EX-99.2
Published on February 13, 2014
Exhibit 99.2
|
|
Fourth Quarter 2013 Earnings Presentation |

|
|
When used in this press release or other written or oral communications, statements which are not historical in nature, including those containing words such as will, believe, expect, anticipate, estimate, plan, continue, intend, should, may or similar expressions, are intended to identify forward-looking statements within the meaning of Section 27A of the Securities Act of 1933, as amended, and Section 21E of the Securities Exchange Act of 1934, as amended, and, as such, may involve known and unknown risks, uncertainties and assumptions. Statements regarding the following subjects, among others, may be forward-looking: changes in interest rates and the market value of MFAs MBS; changes in the prepayment rates on the mortgage loans securing MFAs MBS; changes in the default rates and managements assumptions regarding default rates on the mortgage loans securing MFAs Non-Agency MBS; MFAs ability to borrow to finance its assets and the terms, including the cost, maturity and other terms, of any such borrowing; implementation of or changes in government regulations or programs affecting MFAs business; MFA's estimates regarding taxable income the actual amount of which is dependent on a number of factors, including, but not limited to, changes in the amount of interest income and financing costs, the method elected by the Company to accrete the market discount on Non-Agency MBS and the extent of prepayments, realized losses and changes in the composition of MFA's Agency MBS and Non-Agency MBS portfolios that may occur during the applicable tax period, including gain or loss on any MBS disposals; the timing and amount of distributions to stockholders, which are declared and paid at the discretion of MFA's Board of Directors and will depend on, among other things, MFA's taxable income, its financial results and overall financial condition and liquidity, maintenance of its REIT qualification and such other factors as the Board deems relevant; MFAs ability to maintain its qualification as a REIT for federal income tax purposes; MFAs ability to maintain its exemption from registration under the Investment Company Act of 1940, as amended (or the Investment Company Act), including statements regarding the Concept Release issued by the SEC relating to interpretive issues under the Investment Company Act with respect to the status under the Investment Company Act of certain companies that are in engaged in the business of acquiring mortgages and mortgage-related interests; and risks associated with investing in real estate assets, including changes in business conditions and the general economy. These and other risks, uncertainties and factors, including those described in the annual, quarterly and current reports that MFA files with the Securities and Exchange Commission, could cause MFAs actual results to differ materially from those projected in any forward-looking statements it makes. All forward-looking statements speak only as of the date on which they are made. New risks and uncertainties arise over time and it is not possible to predict those events or how they may affect MFA. Except as required by law, MFA is not obligated to, and does not intend to, update or revise any forward-looking statements, whether as a result of new information, future events or otherwise. 2 Forward Looking Statements |
|
|
3 Net Income Per Common Share $0.20 Fourth Quarter Dividend $0.20 Estimated Taxable Income Per Common Share $0.20 Estimated Undistributed Taxable Income Per Common Share as of December 31, 2013 $0.17 Fourth Quarter 2013 Earnings and Dividends |
|
|
Despite Changing Interest Rates and Prepayment Speeds, MFAs Key Metrics Remained Generally Consistent Throughout 2013 First Quarter 2013 Second Quarter 2013 Third Quarter 2013 Fourth Quarter 2013 Yield on Interest Earning Assets 4.02% 4.01% 4.05% 4.26% Net Interest Rate Spread 2.32% 2.38% 2.24% 2.34% Debt Equity Ratio 3.1x 3.1x 3.1x 3.0x 4 |
|
|
Book Value Increased in the Fourth Quarter due Primarily to the Appreciation of Non-Agency Assets 5 Book Value per common share as of 9/30/13 $ 7.85 Net Income available to common shareholders 0.20 Q4 Common Dividend declared during the quarter (0.20) Net change in value of Agency MBS (0.09) Net change in value of Non-Agency MBS 0.19 Net change in value of hedging and other derivative instruments 0.10 Book Value per common share as of 12/31/13 $ 8.06 |

|
|
REIT Taxable Income Update 6 MFA has now distributed to stockholders an amount equal to all taxable income for years prior to 2013. We currently estimate that for 2013, MFAs REIT taxable income was approximately $374 million, while distributions not attributed to prior years was approximately $313 million. MFA has until the filing of its 2013 tax return (due not later than September 15, 2014), to declare the distribution of any 2013 REIT taxable income not previously distributed. |
|
|
MFAs Interest Rate Sensitivity as Measured by Net Duration, is Below 1.0 Assets Market Value* Average Coupon Duration Non-Agency ARMs (12 months or less MTR) $2,863 2.91% 0.5 Non-Agency Hybrid (12-48 MTR) $621 5.19% 1.1 Non-Agency Fixed Rate $1,500 5.78% 3.5 Agency ARMs (12 months or less MTR) $1,303 2.79% 0.9 Agency ARMs (12-120 MTR) $2,755 3.40% 2.5 Agency 15 Year Fixed Rate $2,460 3.14% 4.3 Cash and Principal Receivable $566 0.0 TOTAL ASSETS $12,068 2.1 Hedging Instruments Notional Amount* Duration Swaps (Less than 3 years) $1,545 -1.0 Swaps (3-6 years) $900 -3.9 Swaps (6-10 years) $1,600 -6.3 TOTAL $4,045 -3.7 Net Duration 0.90 *Data as of 12/31/13, dollars in millions. Non-Agency market value includes approximately $131 million in aggregate of MBS underlying Linked Transactions for GAAP financial reporting purposes. 7 |
|
|
Home price appreciation and mortgage amortization continue to decrease the LTV ratio for many of the mortgages underlying MFAs Non-Agency portfolio. As a result, we have lowered our estimate of future losses within MFAs Non-Agency MBS portfolio. Accordingly, in the fourth quarter, MFA transferred $47.2 million from credit reserve to accretable discount, bringing the total transferred in 2013 to $207.9 million. This increase in accretable discount is expected to increase the interest income realized over the remaining life of MFA's Non-Agency MBS. Information presented as of December 31, 2013. Credit Fundamentals on MFAs Non-Agency MBS Continue to Improve 8 |
|
|
9 Credit Reserve Reductions Increase Future Earnings Credit Reserve reductions increase yields on Non-Agency MBS prospectively Higher yields increase interest income on MFAs Non-Agency MBS over the remaining life of these assets Total credit reserve transfers over 2012 and 2013 have increased Non-Agency portfolio yield by approximately 70 basis points in total Credit Reserve Reductions Do Not Impact Book Value MFAs Book Value is determined by the fair market value of our investment portfolio Credit Reserve Reductions: What is the Impact on Financial Statements? |
|
|
10 Weighted average LTV of MFAs Non-Agency Portfolio continued to trend downward in 2013 The amount of loans in the portfolio that are under water is decreasing Lower LTVs lessen the likelihood of defaults and simultaneously decrease loss severities Data as of 12/31/13 Source: Loan Performance LTVs on MFAs Non-Agency MBS Continued to Decline in 2013 |
|
|
Improving Credit: Home Price Appreciation Drives LTVs Down 11 10.9% of portfolio 5.6% of portfolio 4.8% of portfolio 3.0% of portfolio 2.2% of portfolio MFA Portfolio Top 5 California County Concentrations County % of MFA Non-Agency Portfolio 12 Month Home Price Appreciation Los Angeles 10.9% + 21.0% Orange 5.6% + 21.0% San Diego 4.8% + 20.3% Santa Clara 3.0% + 19.4% Alameda 2.2% + 25.6% 46% of the underlying loans in MFAs Non-Agency portfolio are in California Source: CoreLogic, 1010 data HPA=Home Price Appreciation HPI Data as of November 2013 12 Month HPA >20% 16 - 20% 11 - 15% 6 - 10% 0 - 5% -2 - 0% -5 - -2% No Data |
|
|
Improving Credit: Home Price Appreciation Drives LTVs Down 12 0.9% of portfolio 0.5% of portfolio 0.4% of portfolio 1.1% of portfolio 1.2% of portfolio MFA Portfolio Top 5 Florida County Concentrations County % of MFA Non-Agency Portfolio 12 Month Home Price Appreciation Miami-Dade 1.2% + 10.8% Broward 1.1% + 15.1% Palm Beach 0.9% + 13.8% Orange 0.5% + 11.7% Hillsborough 0.4% + 10.7% Florida makes up MFAs second largest Non-Agency geographic concentration with 8% of the portfolio Source: CoreLogic, 1010 data HPA=Home Price Appreciation HPI Data as of November 2013 12 Month HPA >20% 16 - 20% 11 - 15% 6 - 10% 0 - 5% -2 - 0% -5 - -2% No Data |
|
|
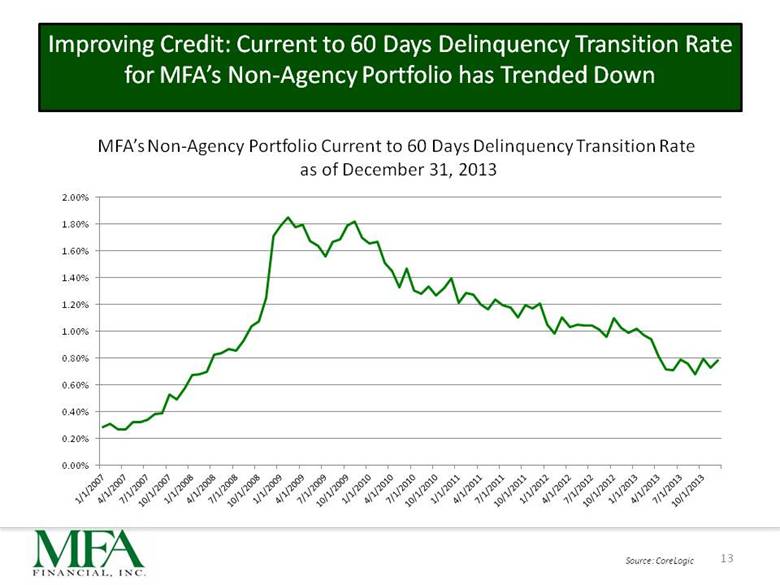
Improving Credit: Current to 60 Days Delinquency Transition Rate for MFAs Non-Agency Portfolio has Trended Down 13 Source: CoreLogic MFAs Non-Agency Portfolio Current to 60 Days Delinquency Transition Rate as of December 31, 2013 |
|
|
Non-Agency Portfolio as of December 31, 2013 Current Face $5,616.0 MFA maintains a substantial credit reserve of $1.0 Billion. Credit assumption changes would impact earnings over time. Dollars in Millions 14 Improving Credit: Yet Substantial Credit Reserves |
|
|
[LOGO] |