EX-99.2
Published on November 4, 2015
Exhibit 99.2
Third Quarter 2015 Earnings Presentation

Forward Looking Statements 2 When used in this presentation or other written or oral communications, statements which are not historical in nature, including those containing words such as will, believe, expect, anticipate, estimate, plan, continue, intend, should, may or similar expressions, are intended to identify forward-looking statements within the meaning of Section 27A of the Securities Act of 1933, as amended, and Section 21E of the Securities Exchange Act of 1934, as amended, and, as such, may involve known and unknown risks, uncertainties and assumptions. Statements regarding the following subjects, among others, may be forward-looking: changes in interest rates and the market value of MFAs MBS; changes in the prepayment rates on the mortgage loans securing MFAs MBS; changes in the default rates and managements assumptions regarding default rates on the mortgage loans securing MFAs Non-Agency MBS; MFAs ability to borrow to finance its assets and the terms, including the cost, maturity and other terms, of any such borrowing; implementation of or changes in government regulations or programs affecting MFAs business; MFA's estimates regarding taxable income the actual amount of which is dependent on a number of factors, including, but not limited to, changes in the amount of interest income and financing costs, the method elected by the Company to accrete the market discount on Non-Agency MBS and the extent of prepayments, realized losses and changes in the composition of MFA's Agency MBS and Non-Agency MBS portfolios that may occur during the applicable tax period, including gain or loss on any MBS disposals; the timing and amount of distributions to stockholders, which are declared and paid at the discretion of MFA's Board of Directors and will depend on, among other things, MFA's taxable income, its financial results and overall financial condition and liquidity, maintenance of its REIT qualification and such other factors as the Board deems relevant; MFAs ability to maintain its qualification as a REIT for federal income tax purposes; MFAs ability to maintain its exemption from registration under the Investment Company Act of 1940, as amended (or the Investment Company Act), including statements regarding the Concept Release issued by the SEC relating to interpretive issues under the Investment Company Act with respect to the status under the Investment Company Act of certain companies that are in engaged in the business of acquiring mortgages and mortgage-related interests; MFAs ability to successfully implement its strategy to grow its residential whole loan portfolio; expected returns on our investments in non-performing residential whole loans (NPLs), which are affected by, among other things, the length of time required to foreclose upon, sell, liquidate or otherwise reach a resolution of the property underlying the NPL, home price values, amounts advanced to carry the asset (e.g., taxes, insurance, maintenance expenses, etc. on the underlying property) and the amount ultimately realized upon resolution of the asset; and risks associated with investing in real estate assets, including changes in business conditions and the general economy. These and other risks, uncertainties and factors, including those described in the annual, quarterly and current reports that MFA files with the Securities and Exchange Commission, could cause MFAs actual results to differ materially from those projected in any forward-looking statements it makes. All forward-looking statements speak only as of the date on which they are made. New risks and uncertainties arise over time and it is not possible to predict those events or how they may affect MFA. Except as required by law, MFA is not obligated to, and does not intend to, update or revise any forward-looking statements, whether as a result of new information, future events or otherwise.
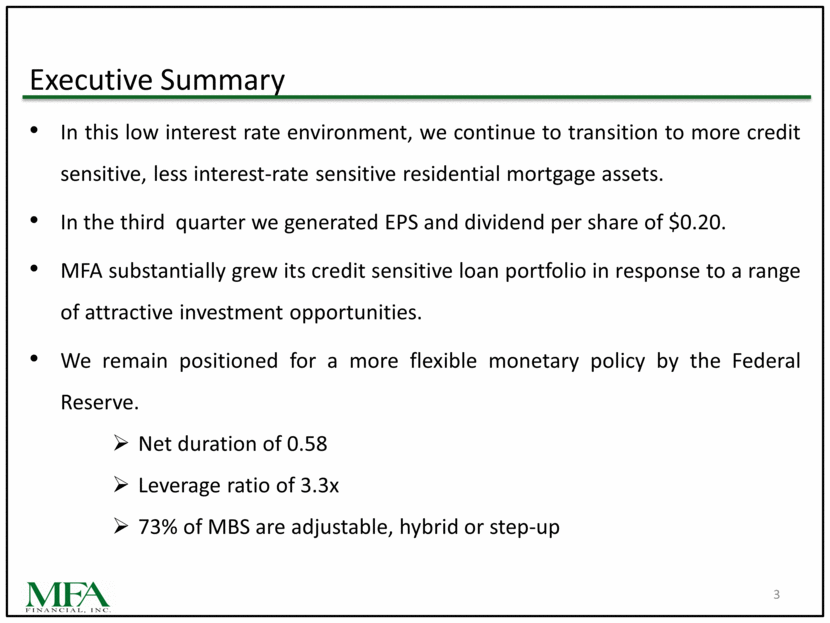
Executive Summary In this low interest rate environment, we continue to transition to more credit sensitive, less interest-rate sensitive residential mortgage assets. In the third quarter we generated EPS and dividend per share of $0.20. MFA substantially grew its credit sensitive loan portfolio in response to a range of attractive investment opportunities. We remain positioned for a more flexible monetary policy by the Federal Reserve. Net duration of 0.58 Leverage ratio of 3.3x 73% of MBS are adjustable, hybrid or step-up 3
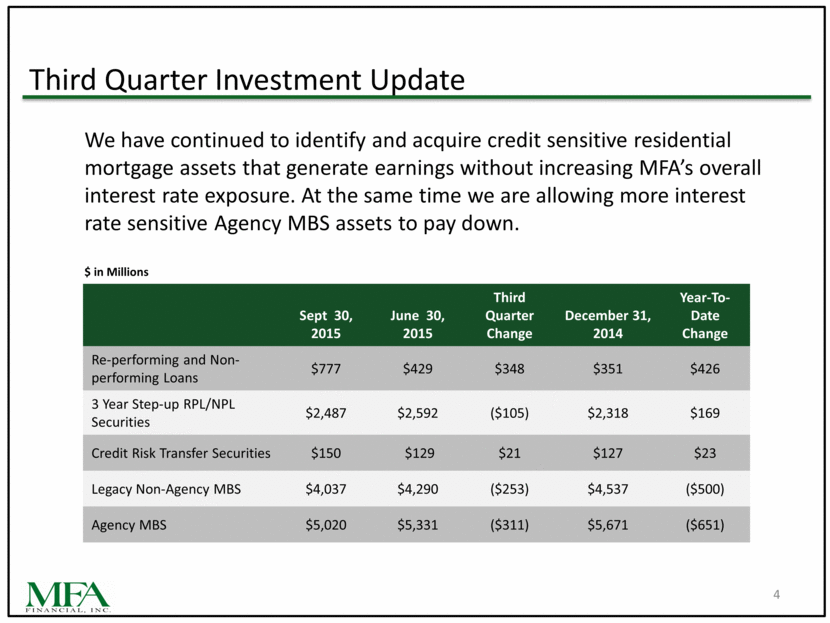
Third Quarter Investment Update We have continued to identify and acquire credit sensitive residential mortgage assets that generate earnings without increasing MFAs overall interest rate exposure. At the same time we are allowing more interest rate sensitive Agency MBS assets to pay down. $ in Millions 4 Sept 30, 2015 June 30, 2015 Third Quarter Change December 31, 2014 Year-To-Date Change Re-performing and Non-performing Loans $777 $429 $348 $351 $426 3 Year Step-up RPL/NPL Securities $2,487 $2,592 ($105) $2,318 $169 Credit Risk Transfer Securities $150 $129 $21 $127 $23 Legacy Non-Agency MBS $4,037 $4,290 ($253) $4,537 ($500) Agency MBS $5,020 $5,331 ($311) $5,671 ($651)
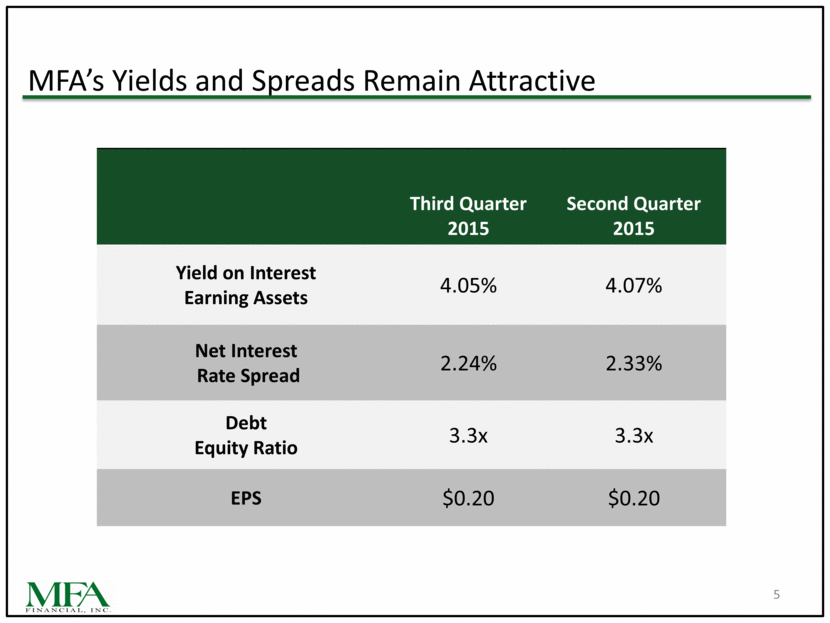
MFAs Yields and Spreads Remain Attractive 5 Third Quarter 2015 Second Quarter 2015 Yield on Interest Earning Assets 4.05% 4.07% Net Interest Rate Spread 2.24% 2.33% Debt Equity Ratio 3.3x 3.3x EPS $0.20 $0.20
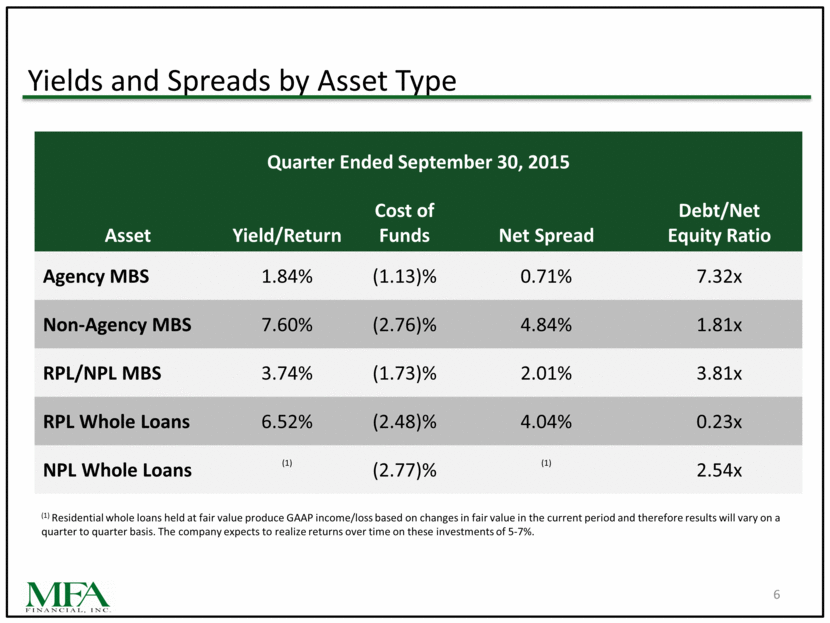
Yields and Spreads by Asset Type 6 Quarter Ended September 30, 2015 Asset Yield/Return Cost of Funds Net Spread Debt/Net Equity Ratio Agency MBS 1.84% (1.13)% 0.71% 7.32x Non-Agency MBS 7.60% (2.76)% 4.84% 1.81x RPL/NPL MBS 3.74% (1.73)% 2.01% 3.81x RPL Whole Loans 6.52% (2.48)% 4.04% 0.23x NPL Whole Loans (1) (2.77)% (1) 2.54x (1) Residential whole loans held at fair value produce GAAP income/loss based on changes in fair value in the current period and therefore results will vary on a quarter to quarter basis. The company expects to realize returns over time on these investments of 5-7%.
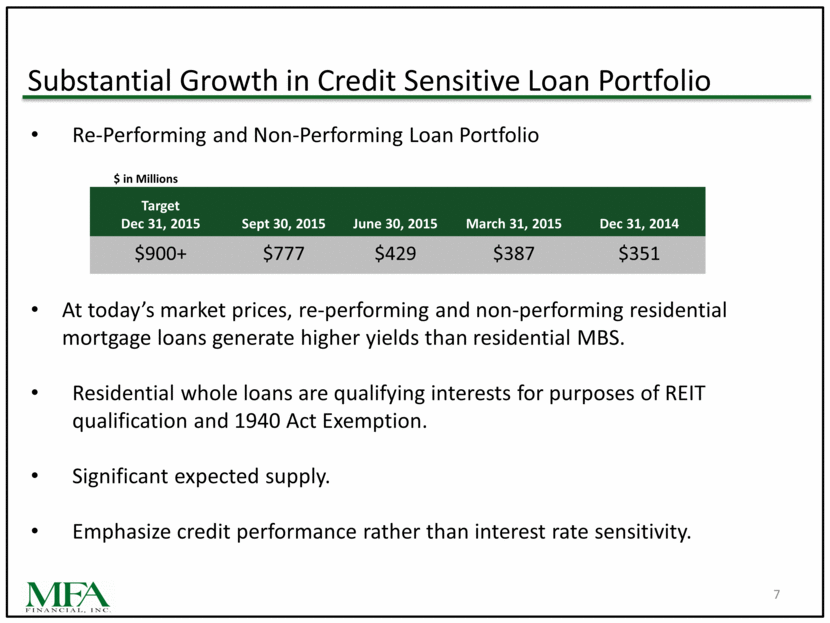
Substantial Growth in Credit Sensitive Loan Portfolio 7 Re-Performing and Non-Performing Loan Portfolio $ in Millions At todays market prices, re-performing and non-performing residential mortgage loans generate higher yields than residential MBS. Residential whole loans are qualifying interests for purposes of REIT qualification and 1940 Act Exemption. Significant expected supply. Emphasize credit performance rather than interest rate sensitivity. Target Dec 31, 2015 Sept 30, 2015 June 30, 2015 March 31, 2015 Dec 31, 2014 $900+ $777 $429 $387 $351
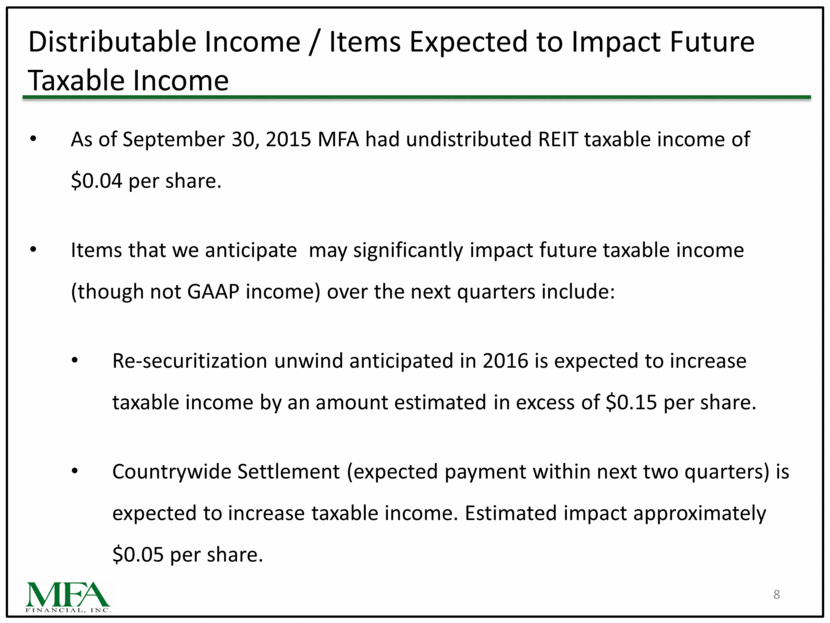
Distributable Income / Items Expected to Impact Future Taxable Income 8 As of September 30, 2015 MFA had undistributed REIT taxable income of $0.04 per share. Items that we anticipate may significantly impact future taxable income (though not GAAP income) over the next quarters include: Re-securitization unwind anticipated in 2016 is expected to increase taxable income by an amount estimated in excess of $0.15 per share. Countrywide Settlement (expected payment within next two quarters) is expected to increase taxable income. Estimated impact approximately $0.05 per share.
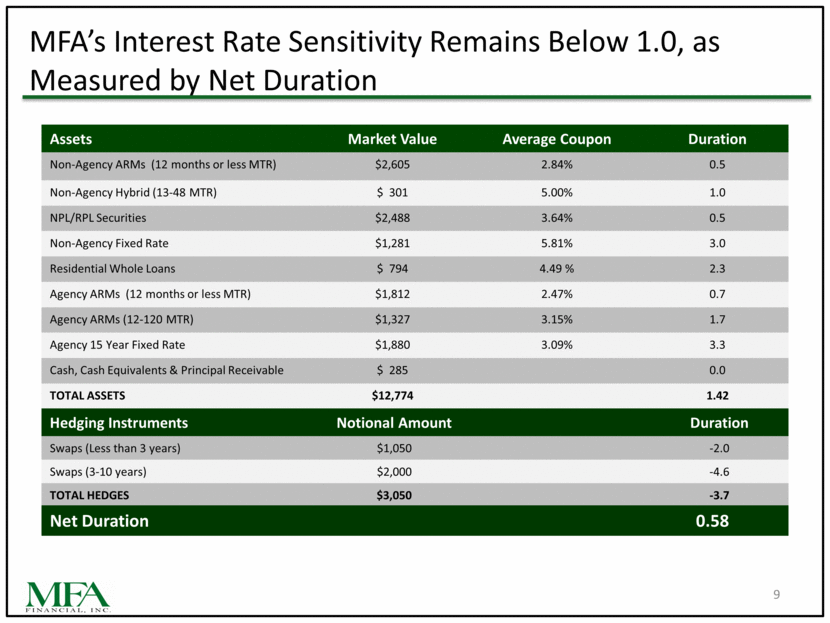
MFAs Interest Rate Sensitivity Remains Below 1.0, as Measured by Net Duration 9 Assets Market Value Average Coupon Duration Non-Agency ARMs (12 months or less MTR) $2,605 2.84% 0.5 Non-Agency Hybrid (13-48 MTR) $ 301 5.00% 1.0 NPL/RPL Securities $2,488 3.64% 0.5 Non-Agency Fixed Rate $1,281 5.81% 3.0 Residential Whole Loans $ 794 4.49 % 2.3 Agency ARMs (12 months or less MTR) $1,812 2.47% 0.7 Agency ARMs (12-120 MTR) $1,327 3.15% 1.7 Agency 15 Year Fixed Rate $1,880 3.09% 3.3 Cash, Cash Equivalents & Principal Receivable $ 285 0.0 TOTAL ASSETS $12,774 1.42 Hedging Instruments Notional Amount Duration Swaps (Less than 3 years) $1,050 -2.0 Swaps (3-10 years) $2,000 -4.6 TOTAL HEDGES $3,050 -3.7 Net Duration 0.58
FHLB Membership 10 In July 2015, MFAs wholly-owned subsidiary, MFA Insurance, Inc., located in Salt Lake City, UT, became a member of the Federal Home Loan Bank of Des Moines. MFA Insurance owns membership stock in the FHLB DM and shares in the risks and benefits of this relationship. MFAs residential investment strategy is consistent with and furthers the core mission of the FHLB system of supporting housing finance. As of September 30, MFA Insurance had $265.0 million of outstanding FHLB advances.

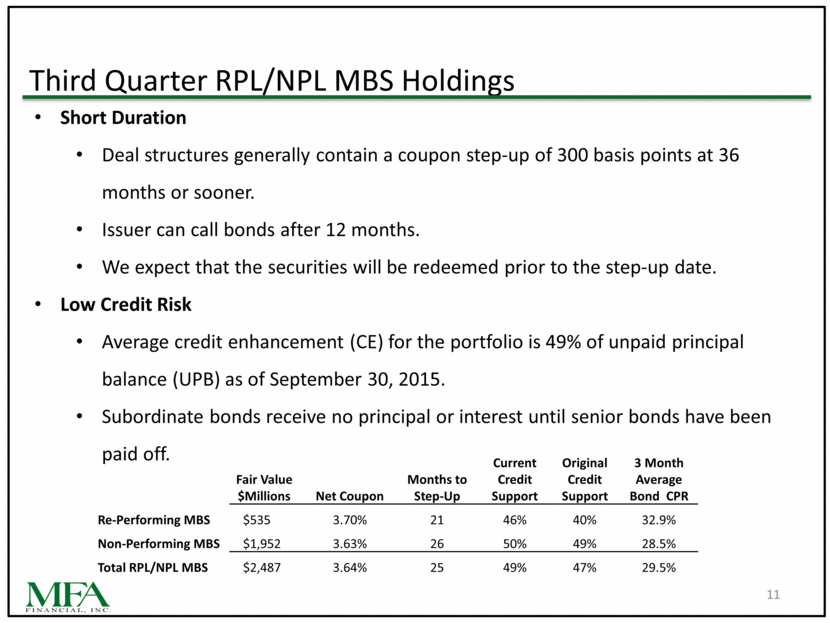
Third Quarter RPL/NPL MBS Holdings 11 Short Duration Deal structures generally contain a coupon step-up of 300 basis points at 36 months or sooner. Issuer can call bonds after 12 months. We expect that the securities will be redeemed prior to the step-up date. Low Credit Risk Average credit enhancement (CE) for the portfolio is 49% of unpaid principal balance (UPB) as of September 30, 2015. Subordinate bonds receive no principal or interest until senior bonds have been paid off. Fair Value $Millions Net Coupon Months to Step-Up Current Credit Support Original Credit Support 3 Month Average Bond CPR Re-Performing MBS $535 3.70% 21 46% 40% 32.9% Non-Performing MBS $1,952 3.63% 26 50% 49% 28.5% Total RPL/NPL MBS $2,487 3.64% 25 49% 47% 29.5%
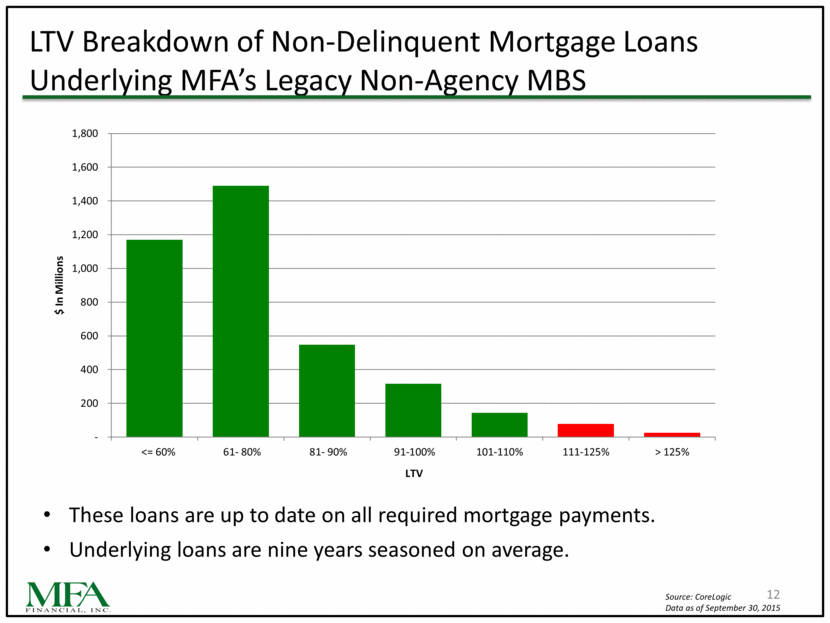
LTV Breakdown of Non-Delinquent Mortgage Loans Underlying MFAs Legacy Non-Agency MBS 12 These loans are up to date on all required mortgage payments. Underlying loans are nine years seasoned on average. Source: CoreLogic Data as of September 30, 2015 - 200 400 600 800 1,000 1,200 1,400 1,600 1,800 <= 60% 61- 80% 81- 90% 91-100% 101-110% 111-125% > 125% $ In Millions LTV
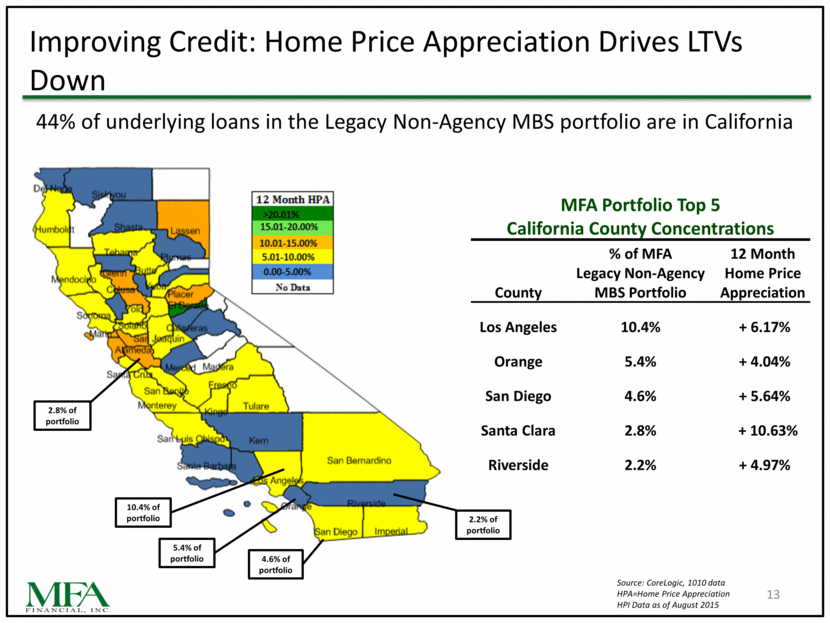
13 MFA Portfolio Top 5 California County Concentrations County % of MFA Legacy Non-Agency MBS Portfolio 12 Month Home Price Appreciation Los Angeles 10.4% + 6.17% Orange 5.4% + 4.04% San Diego 4.6% + 5.64% Santa Clara 2.8% + 10.63% Riverside 2.2% + 4.97% 10.4% of portfolio 5.4% of portfolio 4.6% of portfolio 2.8% of portfolio 2.2% of portfolio Improving Credit: Home Price Appreciation Drives LTVs Down 44% of underlying loans in the Legacy Non-Agency MBS portfolio are in California Source: CoreLogic, 1010 data HPA=Home Price Appreciation HPI Data as of August 2015
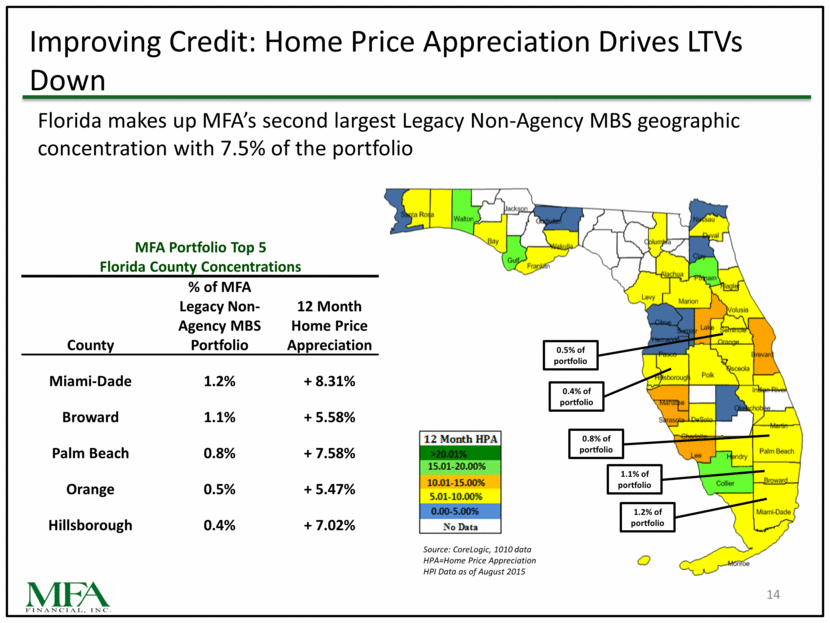
14 MFA Portfolio Top 5 Florida County Concentrations County % of MFA Legacy Non-Agency MBS Portfolio 12 Month Home Price Appreciation Miami-Dade 1.2% + 8.31% Broward 1.1% + 5.58% Palm Beach 0.8% + 7.58% Orange 0.5% + 5.47% Hillsborough 0.4% + 7.02% Florida makes up MFAs second largest Legacy Non-Agency MBS geographic concentration with 7.5% of the portfolio Improving Credit: Home Price Appreciation Drives LTVs Down 1.2% of portfolio 1.1% of portfolio 0.8% of portfolio 0.4% of portfolio 0.5% of portfolio Source: CoreLogic, 1010 data HPA=Home Price Appreciation HPI Data as of August 2015
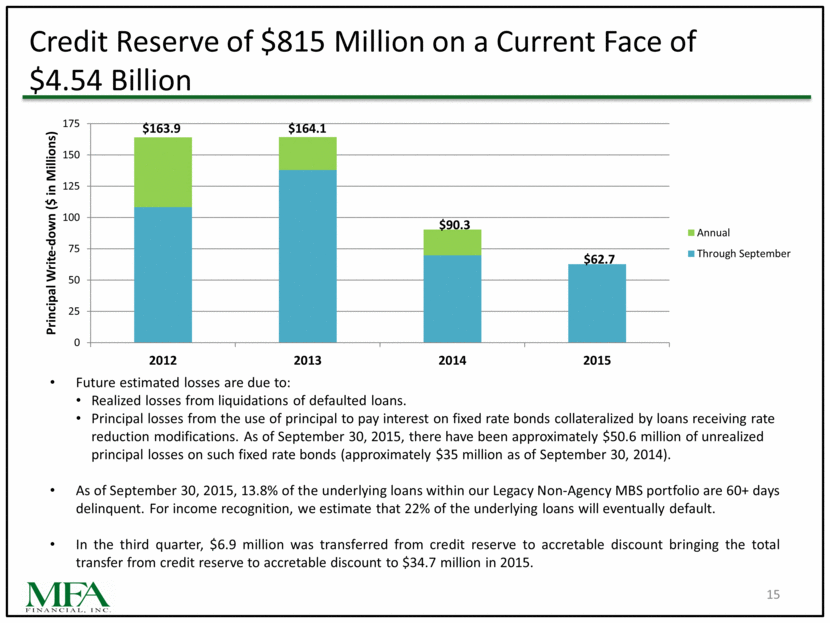
15 Credit Reserve of $815 Million on a Current Face of $4.54 Billion Future estimated losses are due to: Realized losses from liquidations of defaulted loans. Principal losses from the use of principal to pay interest on fixed rate bonds collateralized by loans receiving rate reduction modifications. As of September 30, 2015, there have been approximately $50.6 million of unrealized principal losses on such fixed rate bonds (approximately $35 million as of September 30, 2014). As of September 30, 2015, 13.8% of the underlying loans within our Legacy Non-Agency MBS portfolio are 60+ days delinquent. For income recognition, we estimate that 22% of the underlying loans will eventually default. In the third quarter, $6.9 million was transferred from credit reserve to accretable discount bringing the total transfer from credit reserve to accretable discount to $34.7 million in 2015. $163.9 $164.1 $90.3 $62.7 0 25 50 75 100 125 150 175 2012 2013 2014 2015 Principal Write - down ($ in Millions) Annual Through September
16 Utilizes the same residential mortgage credit expertise we have employed in Legacy Non-Agency MBS since 2008. Ability to oversee servicing decisions (loan modifications, short sales, etc.) to produce better NPV outcomes. As of September 30, 2015, MFA held $777.4 million of loans: $245.9 million of primarily re-performing loans at purchase, held at carrying value $531.5 million of primarily non-performing loans at purchase, held at fair value MFA has obtained financing of $427.6 million through three different warehouse borrowing facilities. MFA actively manages its loan portfolio through in-house asset management professionals and utilizes third-party special servicers. Credit Sensitive Residential Whole Loans: Growing Asset Class for MFA
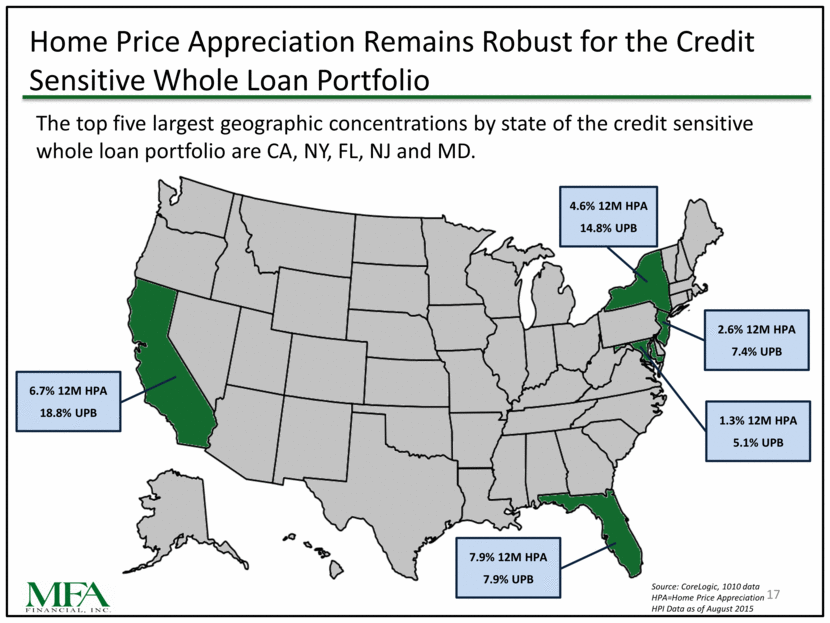
17 Home Price Appreciation Remains Robust for the Credit Sensitive Whole Loan Portfolio The top five largest geographic concentrations by state of the credit sensitive whole loan portfolio are CA, NY, FL, NJ and MD. Source: CoreLogic, 1010 data HPA=Home Price Appreciation HPI Data as of August 2015 4.6% 12M HPA 14.8% UPB 7.9% 12M HPA 7.9% UPB 6.7% 12M HPA 18.8% UPB 2.6% 12M HPA 7.4% UPB 1.3% 12M HPA 5.1% UPB
Summary 18 We continue to utilize our expertise to identify and acquire attractive credit sensitive residential mortgage assets. We have substantially grown our holdings of RPL/NPL mortgage loans in 2015. Our credit sensitive assets continue to perform well. Future Federal Reserve decisions on monetary policy will remain dependent on incoming data. MFA is well positioned for changes in monetary policy and/or interest rates.
19 Additional Information

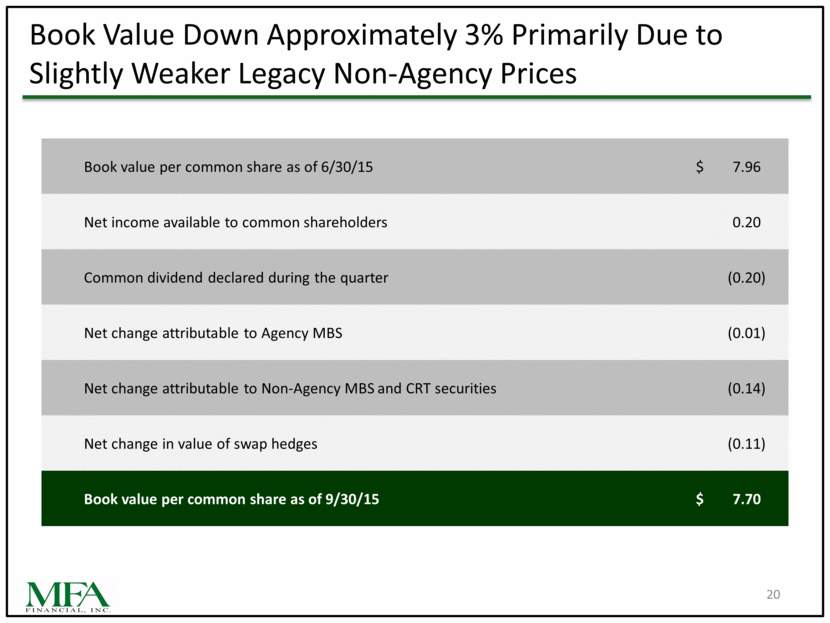
Book Value Down Approximately 3% Primarily Due to Slightly Weaker Legacy Non-Agency Prices 20 Book value per common share as of 6/30/15 $ 7.96 Net income available to common shareholders 0.20 Common dividend declared during the quarter (0.20) Net change attributable to Agency MBS (0.01) Net change attributable to Non-Agency MBS and CRT securities (0.14) Net change in value of swap hedges (0.11) Book value per common share as of 9/30/15 $ 7.70
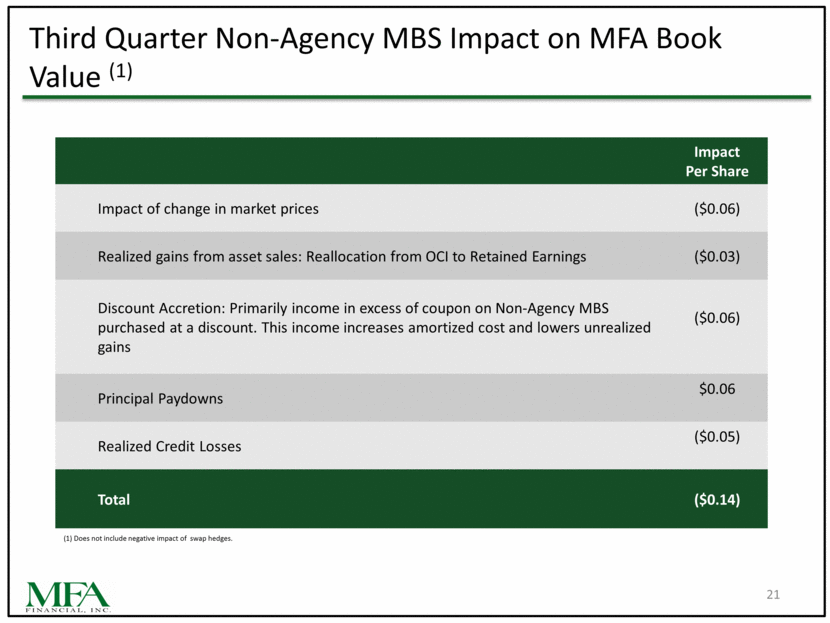
Third Quarter Non-Agency MBS Impact on MFA Book Value (1) 21 Impact Per Share Impact of change in market prices ($0.06) Realized gains from asset sales: Reallocation from OCI to Retained Earnings ($0.03) Discount Accretion: Primarily income in excess of coupon on Non-Agency MBS purchased at a discount. This income increases amortized cost and lowers unrealized gains ($0.06) Principal Paydowns $0.06 Realized Credit Losses ($0.05) Total ($0.14) (1) Does not include negative impact of swap hedges.
