EXHIBIT 99.2
Published on February 19, 2025
|
Company Update FOURTH QUARTER 2024 |
|
2 Q3 2022 Financial Snapshot Forward-looking statements When used in this presentation or other written or oral communications, statements that are not historical in nature, including those containing words such as “will,” “believe,” “expect,” “anticipate,” “estimate,” “plan,” “continue,” “intend,” “should,” “could,” “would,” “may,” the negative of these words or similar expressions, are intended to identify “forward-looking statements” within the meaning of Section 27A of the Securities Act of 1933, as amended, and Section 21E of the Securities Exchange Act of 1934, as amended, and, as such, may involve known and unknown risks, uncertainties and assumptions. These forward-looking statements include information about possible or assumed future results with respect to MFA’s business, financial condition, liquidity, results of operations, plans and objectives. Among the important factors that could cause our actual results to differ materially from those projected in any forward-looking statements that we make are: general economic developments and trends and the performance of the housing, real estate, mortgage finance, broader financial markets; inflation, increases in interest rates and changes in the market (i.e., fair) value of MFA’s residential whole loans, MBS, securitized debt and other assets, as well as changes in the value of MFA’s liabilities accounted for at fair value through earnings; the effectiveness of hedging transactions; changes in the prepayment rates on residential mortgage assets, an increase of which could result in a reduction of the yield on certain investments in its portfolio and could require MFA to reinvest the proceeds received by it as a result of such prepayments in investments with lower coupons, while a decrease in which could result in an increase in the interest rate duration of certain investments in MFA’s portfolio making their valuation more sensitive to changes in interest rates and could result in lower forecasted cash flows; credit risks underlying MFA’s assets, including changes in the default rates and management’s assumptions regarding default rates and loss severities on the mortgage loans in MFA’s residential whole loan portfolio; MFA’s ability to borrow to finance its assets and the terms, including the cost, maturity and other terms, of any such borrowings; implementation of or changes in government regulations or programs affecting MFA’s business (including as a result of the new U.S. Presidential administration); MFA’s estimates regarding taxable income, the actual amount of which is dependent on a number of factors, including, but not limited to, changes in the amount of interest income and financing costs, the method elected by MFA to accrete the market discount on residential whole loans and the extent of prepayments, realized losses and changes in the composition of MFA’s residential whole loan portfolios that may occur during the applicable tax period, including gain or loss on any MBS disposals or whole loan modifications, foreclosures and liquidations; the timing and amount of distributions to stockholders, which are declared and paid at the discretion of MFA’s Board of Directors and will depend on, among otherthings, MFA’s taxable income, its financial results and overall financial condition and liquidity, maintenance of its REIT qualification and such other factors as MFA’s Board of Directors deems relevant; MFA’s ability to maintain its qualification as a REIT for federal income tax purposes; MFA’s ability to maintain its exemption from registration under the Investment Company Act of 1940, as amended (or the “Investment Company Act”), including statements regarding the concept release issued by the Securities and Exchange Commission (“SEC”) relating to interpretive issues under the Investment Company Act with respect to the status under the Investment Company Act of certain companies that are engaged in the business of acquiring mortgages and mortgage-related interests; MFA’s ability to continue growing its residential whole loan portfolio, which is dependent on, among other things, the supply of loans offered for sale in the market; targeted or expected returns on our investments in recently-originated mortgage loans, the performance of which is, similar to our other mortgage loan investments, subject to, among other things, differences in prepayment risk, credit risk and financing costs associated with such investments; risks associated with the ongoing operation of Lima One Holdings, LLC (including, without limitation, industry competition, unanticipated expenditures relating to or liabilities arising from its operation (including, among otherthings, a failure to realize management’s assumptions regarding expected growth in business purpose loan (BPL) origination volumes and credit risks underlying BPLs, including changes in the default rates and management’s assumptions regarding default rates and loss severities on the BPLs originated by Lima One); expected returns on MFA’s investments in nonperforming residential whole loans (“NPLs”), which are affected by, among other things, the length of time required to foreclose upon, sell, liquidate or otherwise reach a resolution of the property underlying the NPL, home price values, amounts advanced to carry the asset (e.g., taxes, insurance, maintenance expenses, etc. on the underlying property) and the amount ultimately realized upon resolution of the asset;risks associated with ourinvestments in MSR-related assets, including servicing,regulatory and economic risks; risks associated with ourinvestments in loan originators;risks associated with investing in real estate assets generally, including changes in business conditions and the general economy; and other risks, uncertainties and factors, including those described in the annual, quarterly and current reports that we file with the SEC. These forward-looking statements are based on beliefs, assumptions and expectations of MFA’s future performance, taking into account information currently available. Readers and listeners are cautioned not to place undue reliance on these forward-looking statements, which speak only as of the date on which they are made. New risks and uncertainties arise over time and it is not possible to predict those events or how they may affect MFA. Except as required by law, MFA is not obligated to, and does not intend to, update or revise any forward-looking statements, whether as a result of new information, future events or otherwise. |
|
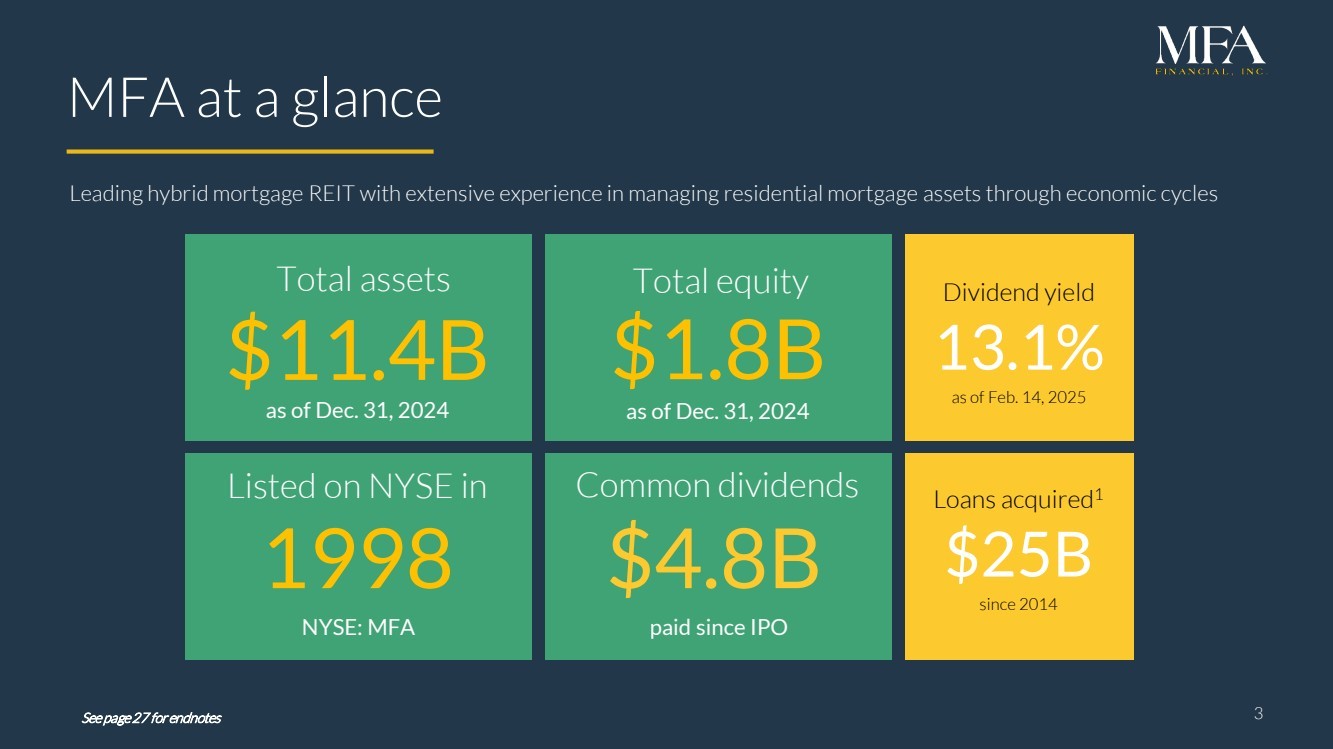
3 v MFA at a glance $1.8B Total equity 1998 Listed on NYSE in Leading hybrid mortgage REIT with extensive experience in managing residential mortgage assets through economic cycles $11.4B Total assets NYSE: MFA $4.8B Common dividends as of Dec. 31, 2024 as of Dec. 31, 2024 paid since IPO See page 27 for endnotes Dividend yield 13.1% as of Feb. 14, 2025 Loans acquired1 $25B since 2014 |
|
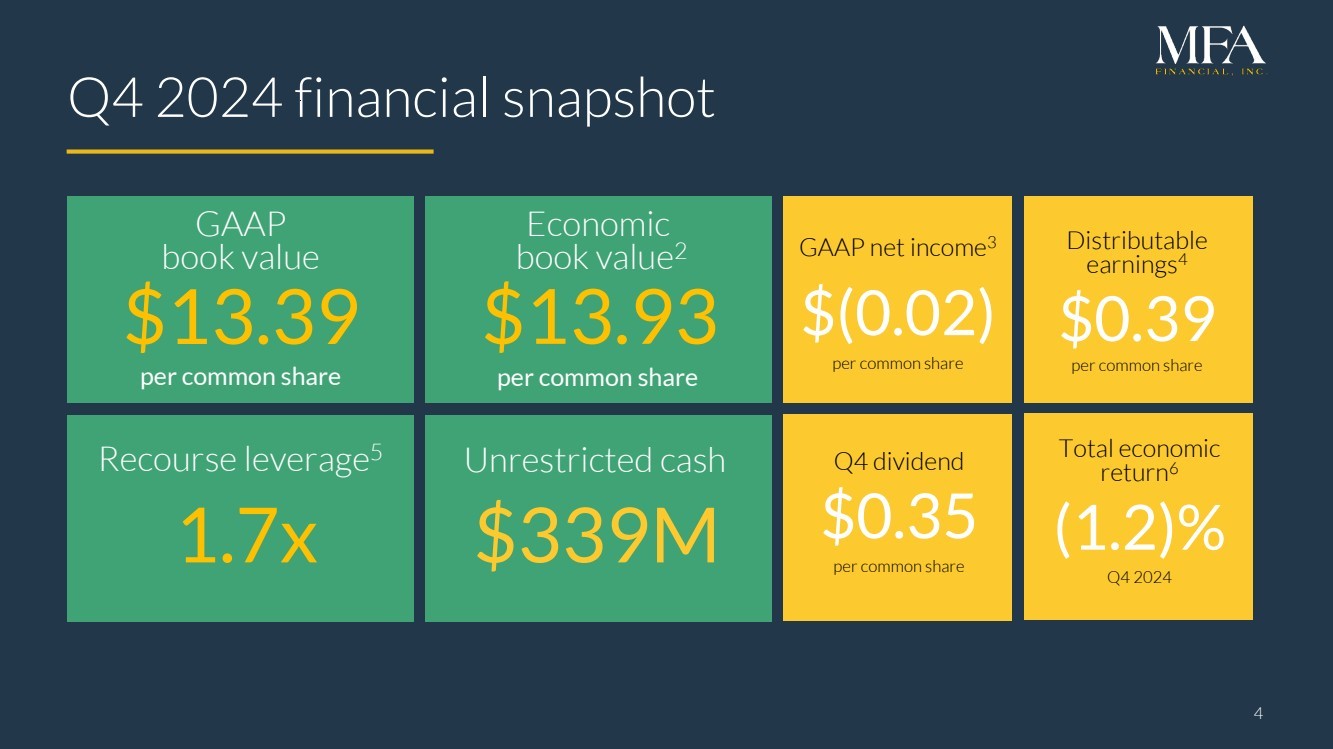
4 Q4 2024 financial snapshot $13.39 $13.93 GAAP net income3 $(0.02) per common share Distributable earnings4 $0.39 per common share GAAP book value Economic book value2 per common share per common share $339M Unrestricted cash 1.7x Recourse leverage5 4 Q4 dividend $0.35 per common share Total economic return6 (1.2)% Q4 2024 |
|
5 Q4 2024 & Full-year Highlights Total economic return of (1.2%) in Q4 and 5.2% for 2024 Economic book value declined by 3.7% in Q4 primarily due to sharp rise in Treasury yields Declared $0.35 dividend for Q4 and $1.40 per share throughout 2024 Acquired $470M of Non-QM residential mortgage loans in Q4 and $1.2B in 2024 Lima One originated $236M of new business purpose loans in Q4, bringing 2024 origination to $1.4B7 Contributed $8.5M of mortgage banking income in Q4 and $33M for 2024 Issued three securitizations collateralized by over $1B UPB of residential loans in Q4 and eight throughout 2024 backed by $2.4B UPB of loans Completed our first rated Transitional loan securitization in Q4 Added $463M of Agency MBS in Q4, growing portfolio to $1.4B Ended year with $339M of unrestricted cash |
|
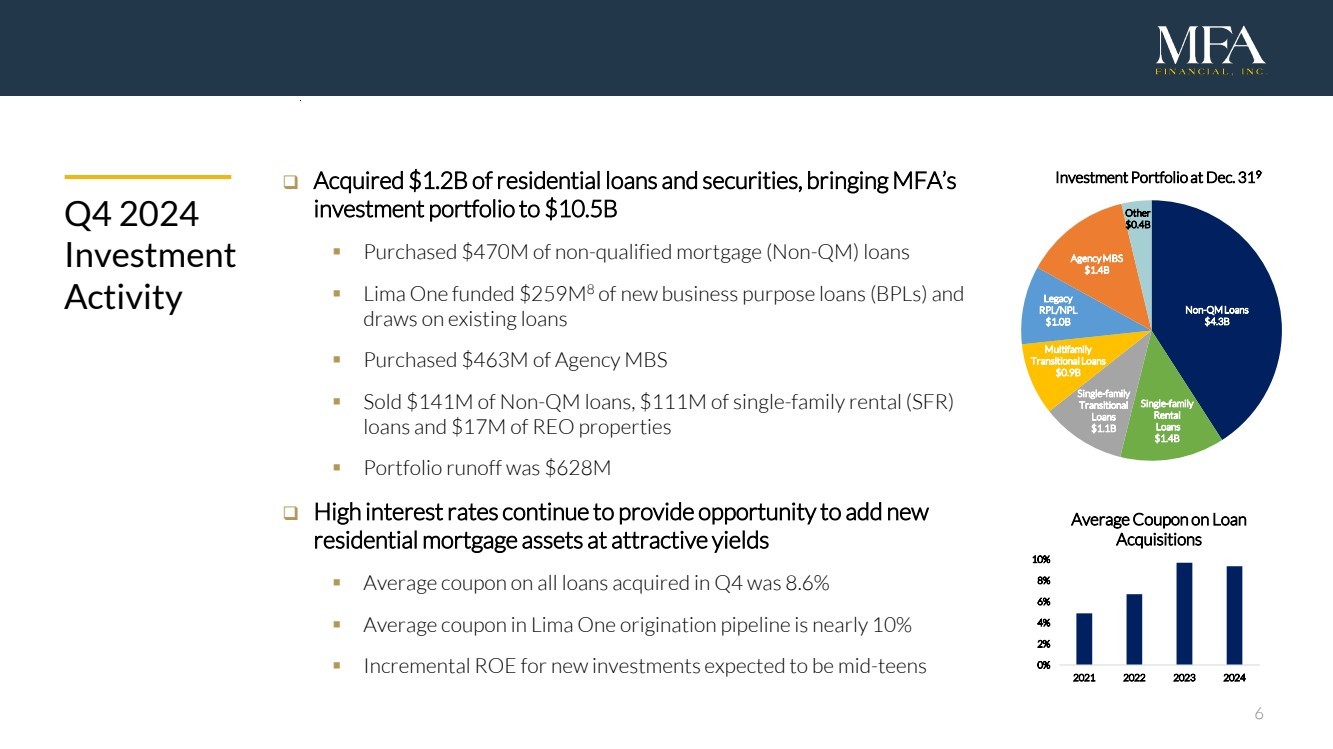
6 Acquired $1.2B of residential loans and securities, bringing MFA’s investment portfolio to $10.5B Purchased $470M of non-qualified mortgage (Non-QM) loans Lima One funded $259M8 of new business purpose loans (BPLs) and draws on existing loans Purchased $463M of Agency MBS Sold $141M of Non-QM loans, $111M of single-family rental (SFR) loans and $17M of REO properties Portfolio runoff was $628M High interest rates continue to provide opportunity to add new residential mortgage assets at attractive yields Average coupon on all loans acquired in Q4 was 8.6% Average coupon in Lima One origination pipeline is nearly 10% Incremental ROE for new investments expected to be mid-teens Q4 2024 Investment Activity 0% 2% 4% 6% 8% 10% 2021 2022 2023 2024 Average Coupon on Loan Acquisitions Non-QM Loans $4.3B Single-family Rental Loans $1.4B Single-family Transitional Loans $1.1B Multifamily Transitional Loans $0.9B Legacy RPL/NPL $1.0B Agency MBS $1.4B Other $0.4B Investment Portfolio at Dec. 319 |
|
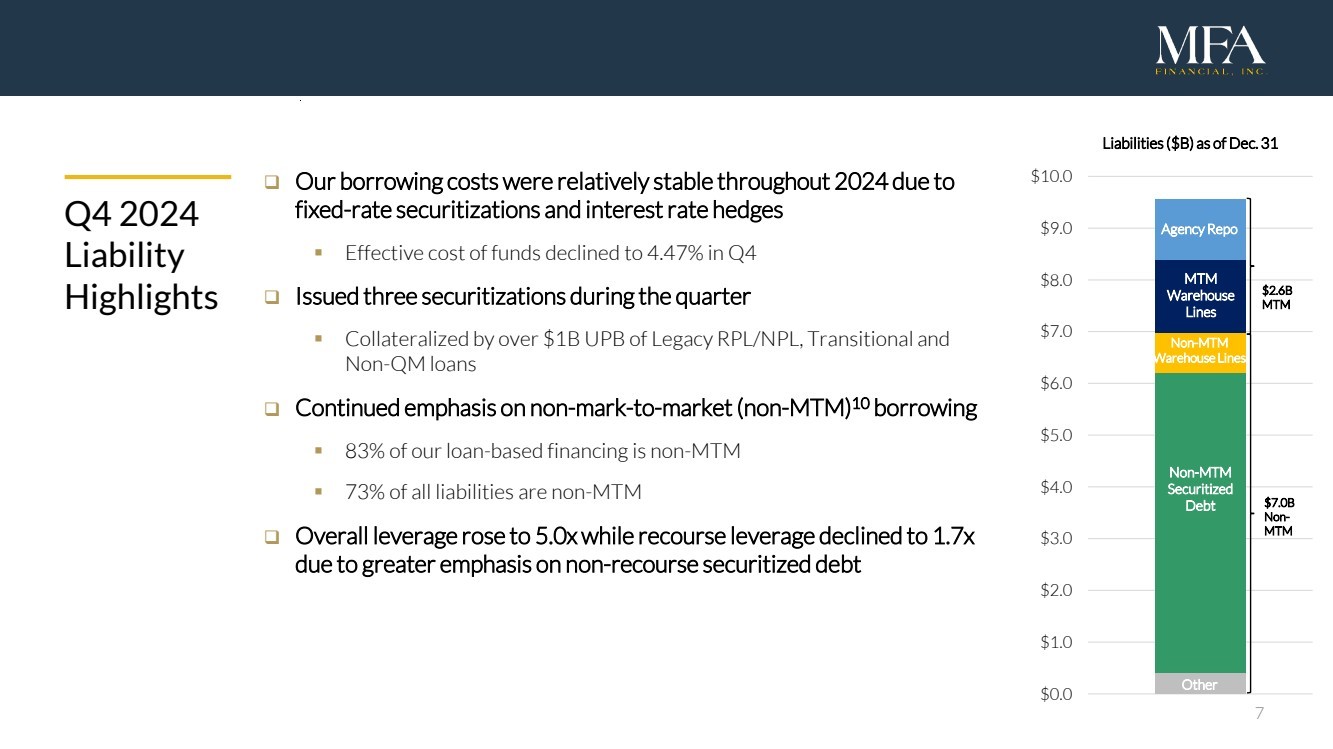
7 Q4 2024 Liability Highlights Our borrowing costs were relatively stable throughout 2024 due to fixed-rate securitizations and interest rate hedges Effective cost of funds declined to 4.47% in Q4 Issued three securitizations during the quarter Collateralized by over $1B UPB of Legacy RPL/NPL, Transitional and Non-QM loans Continued emphasis on non-mark-to-market (non-MTM)10 borrowing 83% of our loan-based financing is non-MTM 73% of all liabilities are non-MTM Overall leverage rose to 5.0x while recourse leverage declined to 1.7x due to greater emphasis on non-recourse securitized debt MTM Warehouse Line Non-MTM Warehouse Line Non-MTM Securitized Debt Other $2.6B MTM $7.0B Non-MTM $0.0 $1.0 $2.0 $3.0 $4.0 $5.0 $6.0 $7.0 $8.0 $9.0 $10.0 Agency Repo MTM Warehouse Lines Non-MTM Warehouse Lines Non-MTM Securitized Debt Other Liabilities ($B) as of Dec. 31 |
|
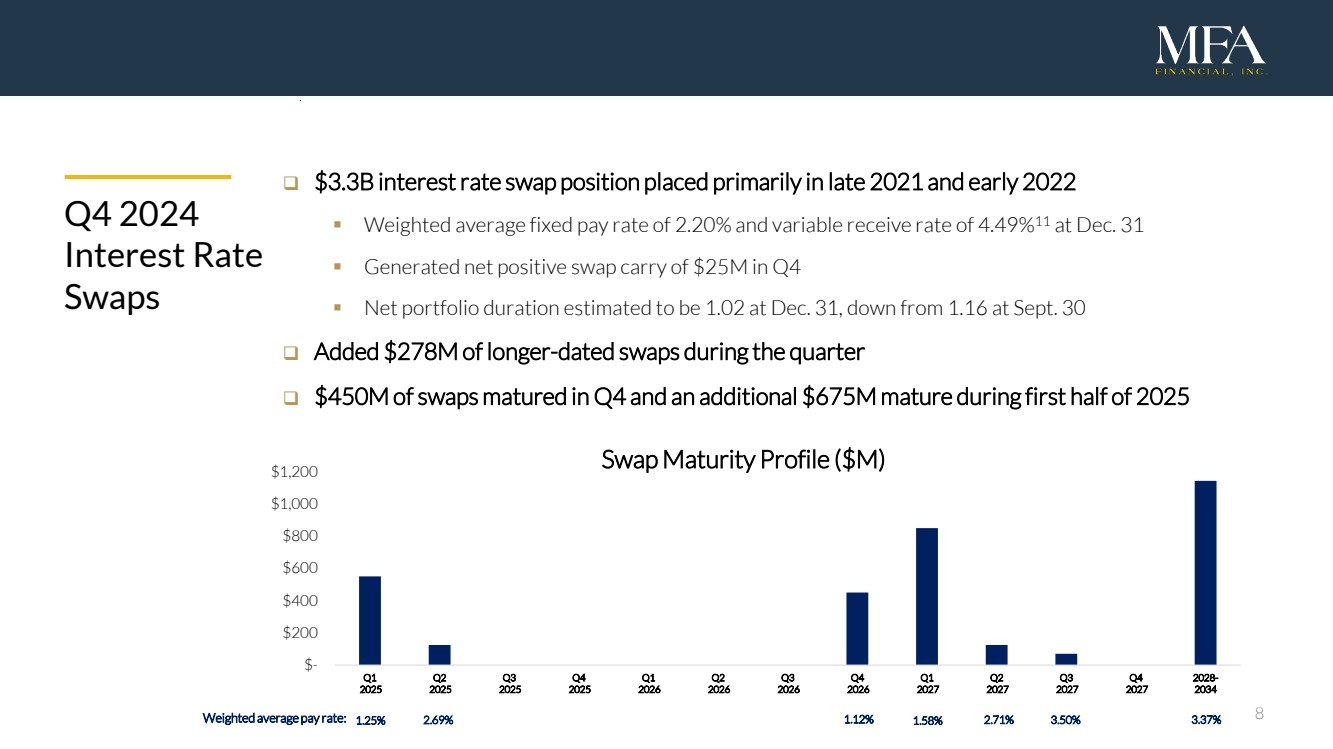
8 Q4 2024 Interest Rate Swaps $3.3B interest rate swap position placed primarily in late 2021 and early 2022 Weighted average fixed pay rate of 2.20% and variable receive rate of 4.49%11 at Dec. 31 Generated net positive swap carry of $25M in Q4 Net portfolio duration estimated to be 1.02 at Dec. 31, down from 1.16 at Sept. 30 Added $278M of longer-dated swaps during the quarter $450M of swaps matured in Q4 and an additional $675M mature during first half of 2025 Weighted average pay rate: 1.25% 2.69% 1.12% 1.58% 2.71% 3.50% 3.37% $- $200 $400 $600 $800 $1,000 $1,200 Q1 2025 Q2 2025 Q3 2025 Q4 2025 Q1 2026 Q2 2026 Q3 2026 Q4 2026 Q1 2027 Q2 2027 Q3 2027 Q4 2027 2028- 2034 Swap Maturity Profile ($M) |
|
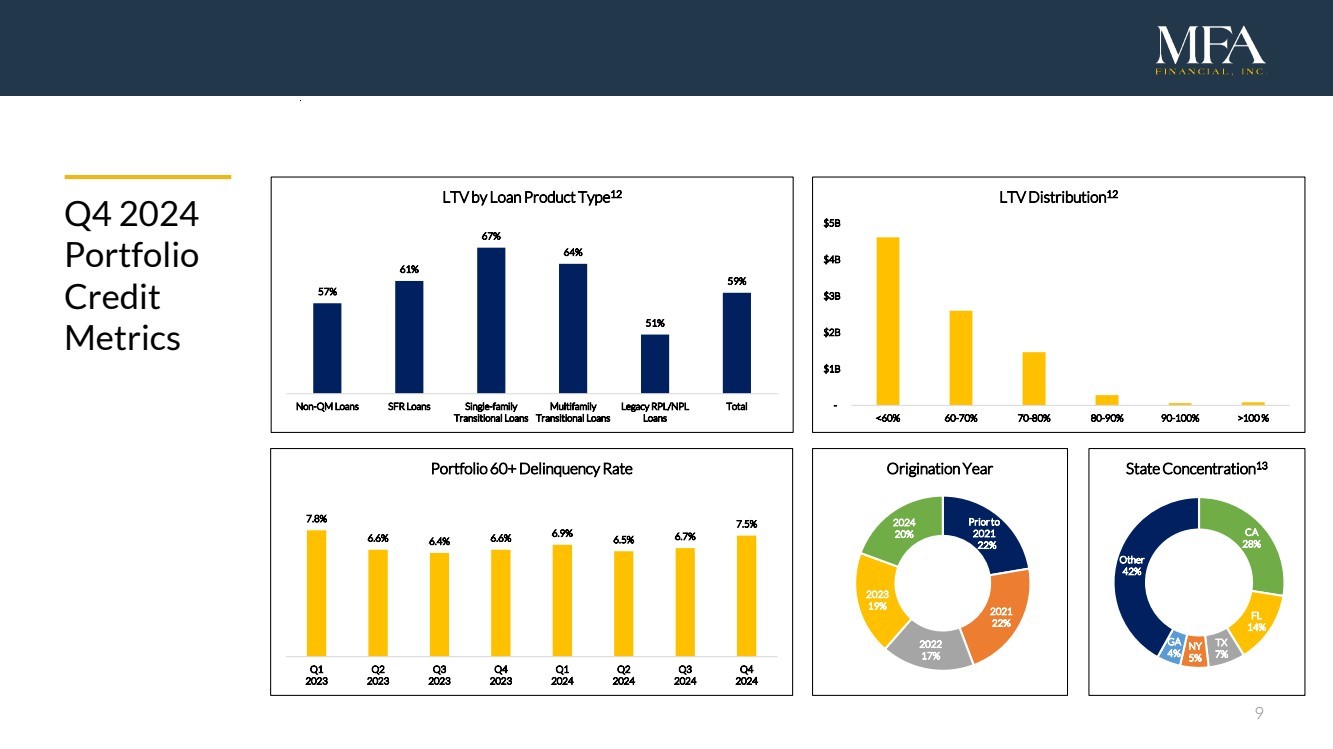
9 Q4 2024 Portfolio Credit Metrics - $1B $2B $3B $4B $5B <60% 60-70% 70-80% 80-90% 90-100% >100 % LTV Distribution12 57% 61% 67% 64% 51% 59% Non-QM Loans SFR Loans Single-family Transitional Loans Multifamily Transitional Loans Legacy RPL/NPL Loans Total LTV by Loan Product Type12 7.8% 6.6% 6.4% 6.6% 6.9% 6.5% 6.7% 7.5% Q1 2023 Q2 2023 Q3 2023 Q4 2023 Q1 2024 Q2 2024 Q3 2024 Q4 2024 Portfolio 60+ Delinquency Rate Prior to 2021 22% 2021 22% 2022 17% 2023 19% 2024 20% Origination Year CA 28% FL 14% TX 7% NY 5% GA 4% Other 42% State Concentration13 |
|
10 Origination volume was $236M in Q4 and $1.4B for 20247 Single-family Transitional loan originations totaled $168M in Q4 $76M of ground-up construction loans $61M of rehab (“fix/flip”) loans $31M of bridge loans SFR loan originations were $68M Continued programmatic sales of new origination to 3rd party investors Regular loan sales strengthen Lima One’s franchise value and enhance MFA’s returns Sold $111M of newly-originated SFR loans, generating approximately $4M of gain-on-sale income Mortgage banking income totaled $8.5M for the quarter and $33M throughout 2024 Q4 2024 Lima One Highlights |
|
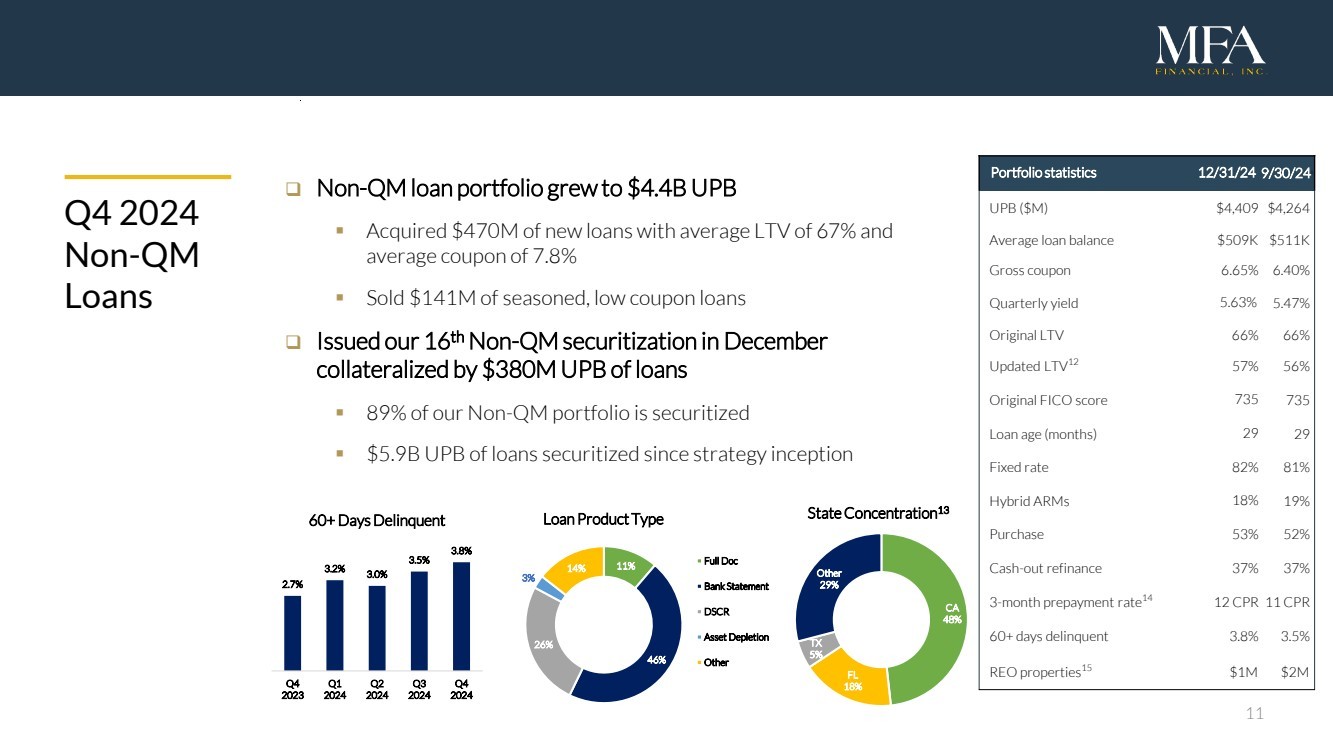
11 Q4 2024 Non-QM Loans Non-QM loan portfolio grew to $4.4B UPB Acquired $470M of new loans with average LTV of 67% and average coupon of 7.8% Sold $141M of seasoned, low coupon loans Issued our 16th Non-QM securitization in December collateralized by $380M UPB of loans 89% of our Non-QM portfolio is securitized $5.9B UPB of loans securitized since strategy inception Portfolio statistics 12/31/24 9/30/241 UPB ($M) $4,409 $4,2641 Average loan balance $509K $511K1 Gross coupon 6.65% 6.40%1 Quarterly yield 5.63% 5.47%1 Original LTV 66% 66%1 Updated LTV12 57% 56%1 Original FICO score 735 7351 Loan age (months) 29 291 Fixed rate 82% 81%1 Hybrid ARMs 18% 19%1 Purchase 53% 52%1 Cash-out refinance 37% 37%1 3-month prepayment rate14 12 CPR 11 CPR1 60+ days delinquent 3.8% 3.5%1 REO properties15 $1M $2M 2.7% 3.2% 3.0% 3.5% 3.8% Q4 2023 Q1 2024 Q2 2024 Q3 2024 Q4 2024 60+ Days Delinquent CA 48% FL 18% TX 5% Other 29% State Concentration13 11% 46% 26% 3% 14% Loan Product Type Full Doc Bank Statement DSCR Asset Depletion Other |
|
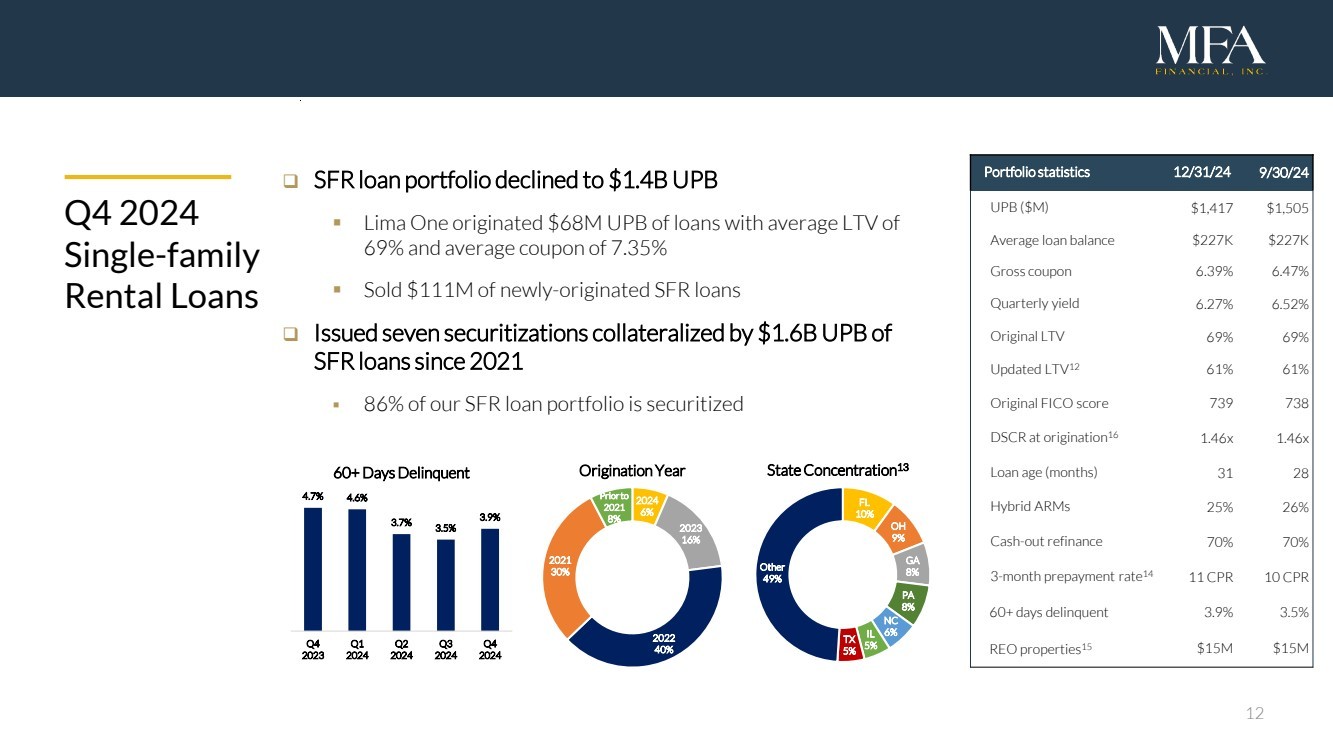
12 Portfolio statistics 12/31/24 9/30/24 UPB ($M) $1,417 $1,505d Average loan balance $227K $227Kd Gross coupon 6.39% 6.47%d Quarterly yield 6.27% 6.52%d Original LTV 69% 69%d Updated LTV12 61% 61%d Original FICO score 739 738d DSCR at origination16 1.46x 1.46xd Loan age (months) 31 28d Hybrid ARMs 25% 26%d Cash-out refinance 70% 70%d 3-month prepayment rate14 11 CPR 10 CPRd 60+ days delinquent 3.9% 3.5%d REO properties15 $15M $15Md Q4 2024 Single-family Rental Loans SFR loan portfolio declined to $1.4B UPB Lima One originated $68M UPB of loans with average LTV of 69% and average coupon of 7.35% Sold $111M of newly-originated SFR loans Issued seven securitizations collateralized by $1.6B UPB of SFR loans since 2021 86% of our SFR loan portfolio is securitized 2024 6% 2023 16% 2022 40% 2021 30% Prior to 2021 8% Origination Year 4.7% 4.6% 3.7% 3.5% 3.9% Q4 2023 Q1 2024 Q2 2024 Q3 2024 Q4 2024 60+ Days Delinquent FL 10% OH 9% GA 8% PA 8% NC IL 6% 5% TX 5% Other 49% State Concentration13 |
|
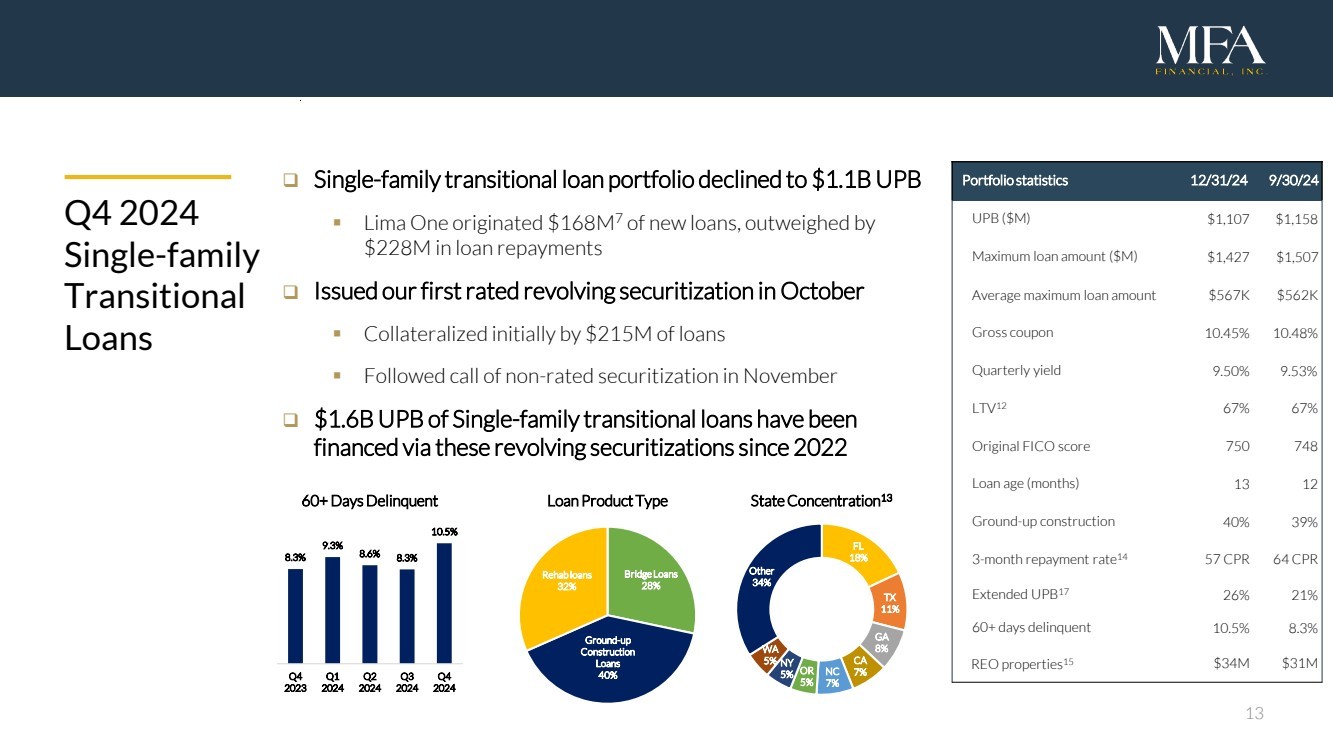
13 Portfolio statistics 12/31/24 9/30/24 UPB ($M) $1,107 $1,158d Maximum loan amount ($M) $1,427 $1,507f Average maximum loan amount $567K $562Kd Gross coupon 10.45% 10.48%d Quarterly yield 9.50% 9.53%d LTV12 67% 67%d Original FICO score 750 748d Loan age (months) 13 12d Ground-up construction 40% 39%d 3-month repayment rate14 57 CPR 64 CPRd Extended UPB17 26% 21%d 60+ days delinquent 10.5% 8.3%d REO properties15 $34M $31Md Q4 2024 Single-family Transitional Loans Single-family transitional loan portfolio declined to $1.1B UPB Lima One originated $168M7 of new loans, outweighed by $228M in loan repayments Issued our first rated revolving securitization in October Collateralized initially by $215M of loans Followed call of non-rated securitization in November $1.6B UPB of Single-family transitional loans have been financed via these revolving securitizations since 2022 FL 18% TX 11% GA 8% CA NC 7% 7% OR 5% NY 5% WA 5% Other 34% State Concentration13 8.3% 9.3% 8.6% 8.3% 10.5% Q4 2023 Q1 2024 Q2 2024 Q3 2024 Q4 2024 60+ Days Delinquent Bridge Loans 28% Ground-up Construction Loans 40% Rehab loans 32% Loan Product Type |
|
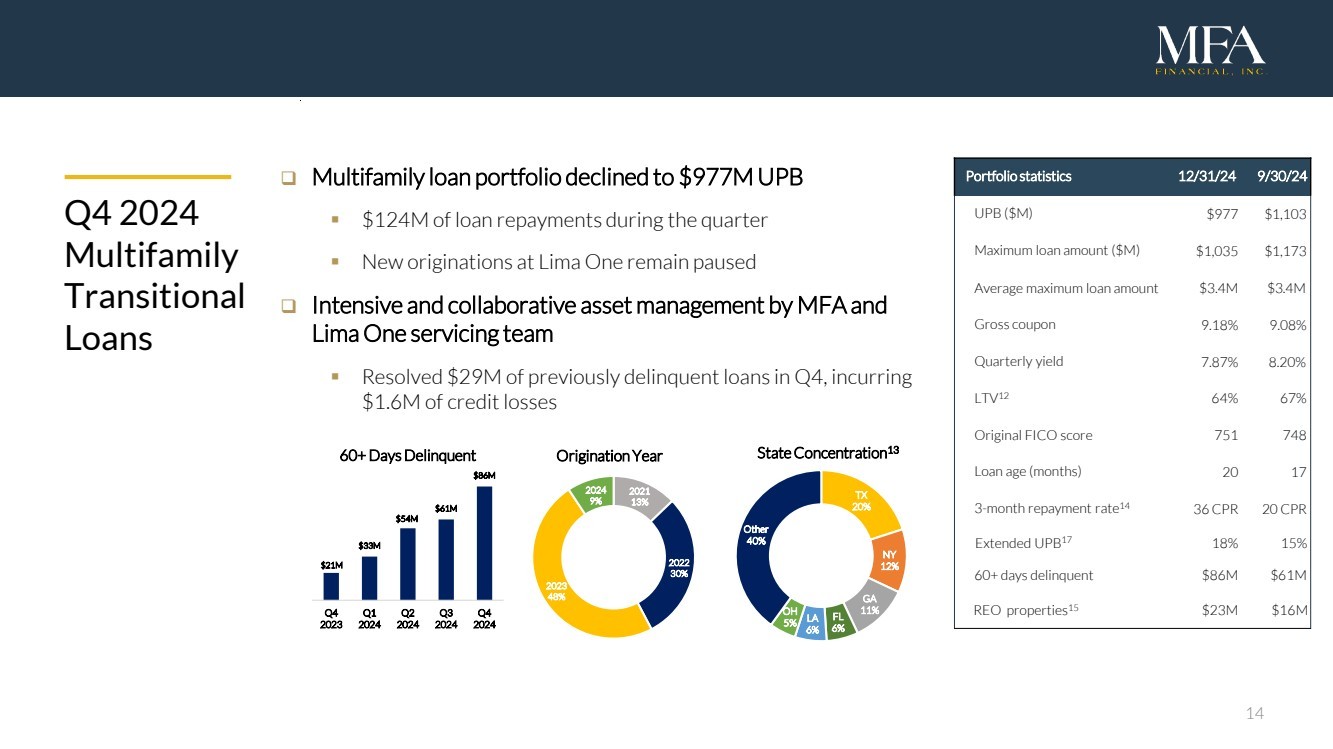
14 Portfolio statistics 12/31/24 9/30/24 UPB ($M) $977 $1,103d Maximum loan amount ($M) $1,035 $1,173d Average maximum loan amount $3.4M $3.4Md Gross coupon 9.18% 9.08%d Quarterly yield 7.87% 8.20%d LTV12 64% 67%d Original FICO score 751 748d Loan age (months) 20 17d 3-month repayment rate14 36 CPR 20 CPRd Extended UPB17 18% 15%s 60+ days delinquent $86M $61Md REO properties15 $23M $16M Q4 2024 Multifamily Transitional Loans Multifamily loan portfolio declined to $977M UPB $124M of loan repayments during the quarter New originations at Lima One remain paused Intensive and collaborative asset management by MFA and Lima One servicing team Resolved $29M of previously delinquent loans in Q4, incurring $1.6M of credit losses 2021 13% 2022 30% 2023 48% 2024 9% Origination Year TX 20% NY 12% GA 11% FL 6% LA 6% OH 5% Other 40% State Concentration13 $21M $33M $54M $61M $86M Q4 2023 Q1 2024 Q2 2024 Q3 2024 Q4 2024 60+ Days Delinquent |
|
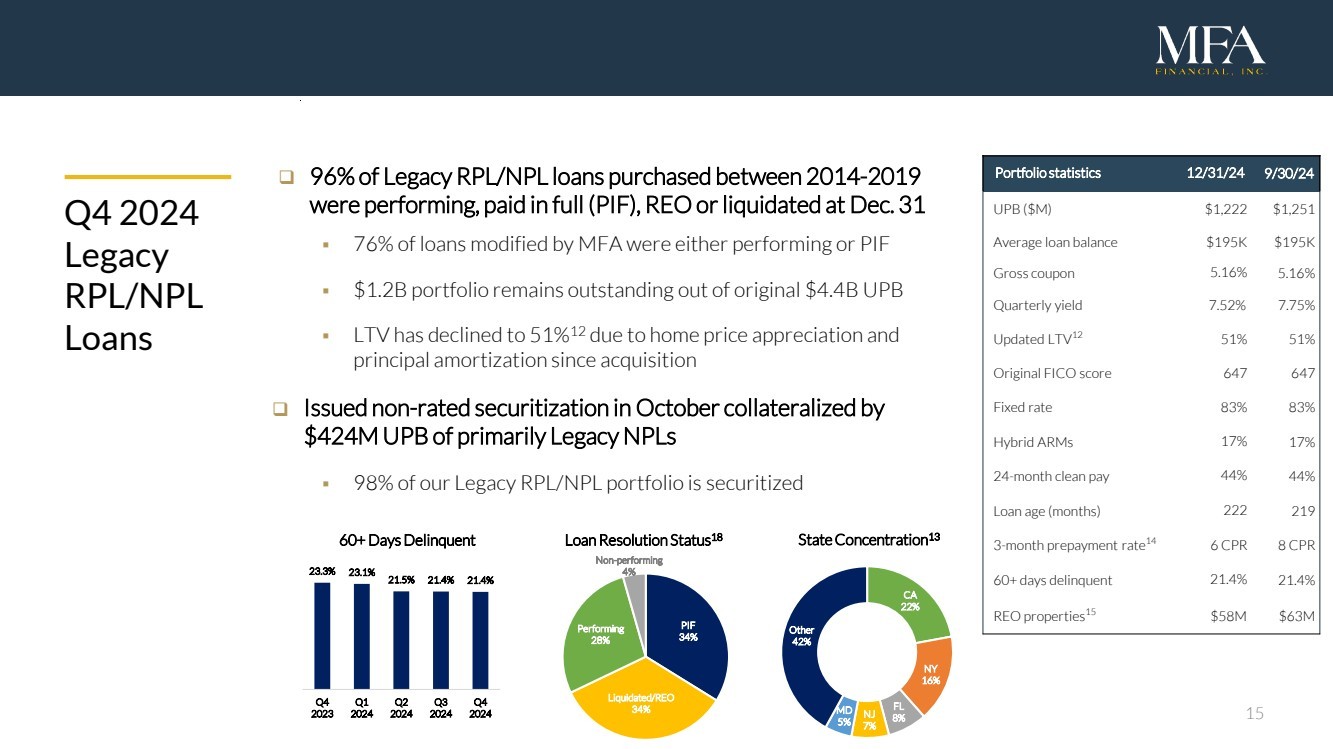
15 Q4 2024 Legacy RPL/NPL Loans 96% of Legacy RPL/NPL loans purchased between 2014-2019 were performing, paid in full (PIF), REO or liquidated at Dec. 31 76% of loans modified by MFA were either performing or PIF $1.2B portfolio remains outstanding out of original $4.4B UPB LTV has declined to 51%12 due to home price appreciation and principal amortization since acquisition Issued non-rated securitization in October collateralized by $424M UPB of primarily Legacy NPLs 98% of our Legacy RPL/NPL portfolio is securitized Portfolio statistics 12/31/24 9/30/24 UPB ($M) $1,222 $1,2511 Average loan balance $195K $195K1 Gross coupon 5.16% 5.16%1 Quarterly yield 7.52% 7.75%1 Updated LTV12 51% 51%1 Original FICO score 647 6471 Fixed rate 83% 83%1 Hybrid ARMs 17% 17%1 24-month clean pay 44% 44%1 Loan age (months) 222 2191 3-month prepayment rate14 6 CPR 8 CPR1 60+ days delinquent 21.4% 21.4%1 REO properties15 $58M $63M1 23.3% 23.1% 21.5% 21.4% 21.4% Q4 2023 Q1 2024 Q2 2024 Q3 2024 Q4 2024 60+ Days Delinquent PIF 34% Liquidated/REO 34% Performing 28% Non-performing 4% Loan Resolution Status18 CA 22% NY 16% FL 8% NJ 7% MD 5% Other 42% State Concentration13 |
|
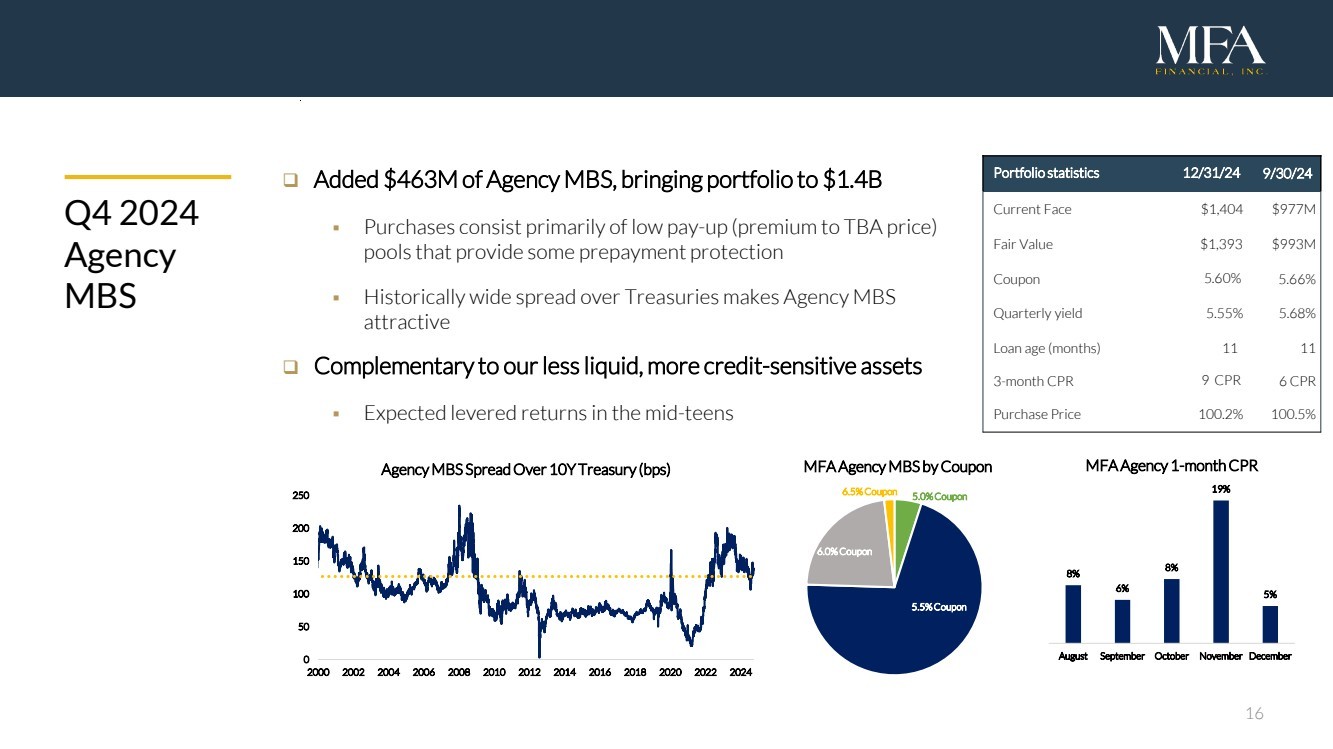
16 Q4 2024 Agency MBS Added $463M of Agency MBS, bringing portfolio to $1.4B Purchases consist primarily of low pay-up (premium to TBA price) pools that provide some prepayment protection Historically wide spread over Treasuries makes Agency MBS attractive Complementary to our less liquid, more credit-sensitive assets Expected levered returns in the mid-teens Portfolio statistics 12/31/24 9/30/24 Current Face $1,404 $977M1 Fair Value $1,393 $993M1 Coupon 5.60% 5.66%1 Quarterly yield 5.55% 5.68%1 Loan age (months) 11 111 3-month CPR 9 CPR 6 CPR1 Purchase Price 100.2% 100.5%1 0 50 100 150 200 250 2000 2002 2004 2006 2008 2010 2012 2014 2016 2018 2020 2022 2024 Agency MBS Spread Over 10Y Treasury (bps) 8% 6% 8% 19% 5% August September October November December MFA Agency 1-month CPR 5.0% Coupon 5.5% Coupon 6.0% Coupon 6.5% Coupon MFA Agency MBS by Coupon |
|
17 Appendix James Casebere, Landscape with Houses (Dutchess County, NY) #2, 2010 (detail) |

|
18 MFA Financial Overview MFA Financial, Inc. (NYSE: MFA) is an internally managed real estate investment trust (REIT) that invests in U.S. residential mortgage loans and mortgage-backed securities MFA focuses primarily on mortgage subsectors in which it tries to avoid direct competition with banks and government-sponsored enterprises MFA owns a diversified portfolio of business purpose loans (BPLs), non-qualified mortgage (Non-QM) loans, re-performing/non-performing loans (Legacy RPL/NPLs) and residential mortgage-backed securities In 2021, MFA acquired Lima One Capital, a leading nationwide BPL originator and servicer with over $10B7 in originations since its formation in 2010 MFA originates BPLs directly through Lima One and acquires Non-QM loans through flow and mini-bulk arrangements with a select group of originators with which it holds strong relationships MFA operates a leading residential credit securitization platform with $10.7B of issuance since inception MFA has deep expertise in residential credit as well as a long history of investing in new asset classes when compelling opportunities arise Since its IPO in 1998, MFA has distributed $4.8 billion of dividends to its stockholders |
|
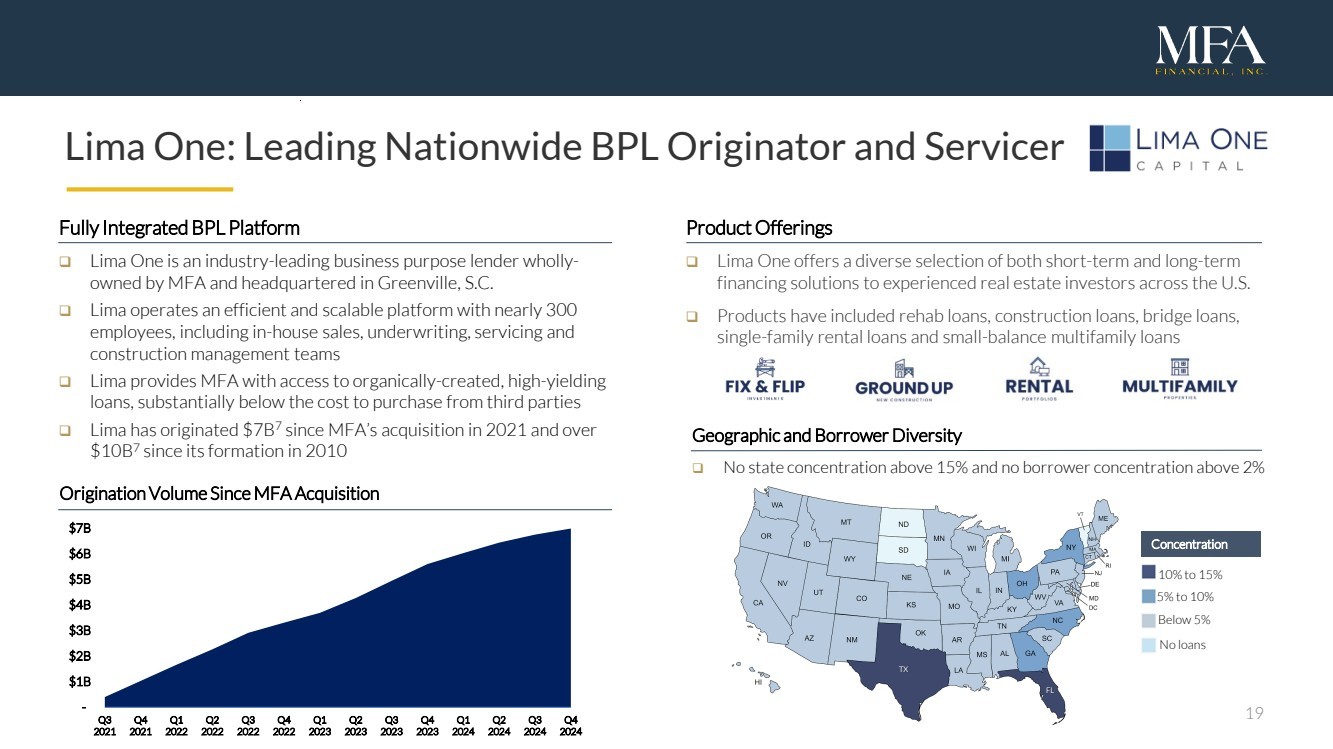
19 Lima One: Leading Nationwide BPL Originator and Servicer Product Offerings Lima One offers a diverse selection of both short-term and long-term financing solutions to experienced real estate investors across the U.S. Products have included rehab loans, construction loans, bridge loans, single-family rental loans and small-balance multifamily loans Fully Integrated BPL Platform Lima One is an industry-leading business purpose lender wholly-owned by MFA and headquartered in Greenville, S.C. Lima operates an efficient and scalable platform with nearly 300 employees, including in-house sales, underwriting, servicing and construction management teams Lima provides MFA with access to organically-created, high-yielding loans, substantially below the cost to purchase from third parties Lima has originated $7B7 since MFA’s acquisition in 2021 and over $10B7 since its formation in 2010 Geographic and Borrower Diversity No state concentration above 15% and no borrower concentration above 2% Concentration 10% to 15% 5% to 10% Below 5% No loans TX FL TX FL Origination Volume Since MFA Acquisition - $1B $2B $3B $4B $5B $6B $7B Q3 2021 Q4 2021 Q1 2022 Q2 2022 Q3 2022 Q4 2022 Q1 2023 Q2 2023 Q3 2023 Q4 2023 Q1 2024 Q2 2024 Q3 2024 Q4 2024 |
|
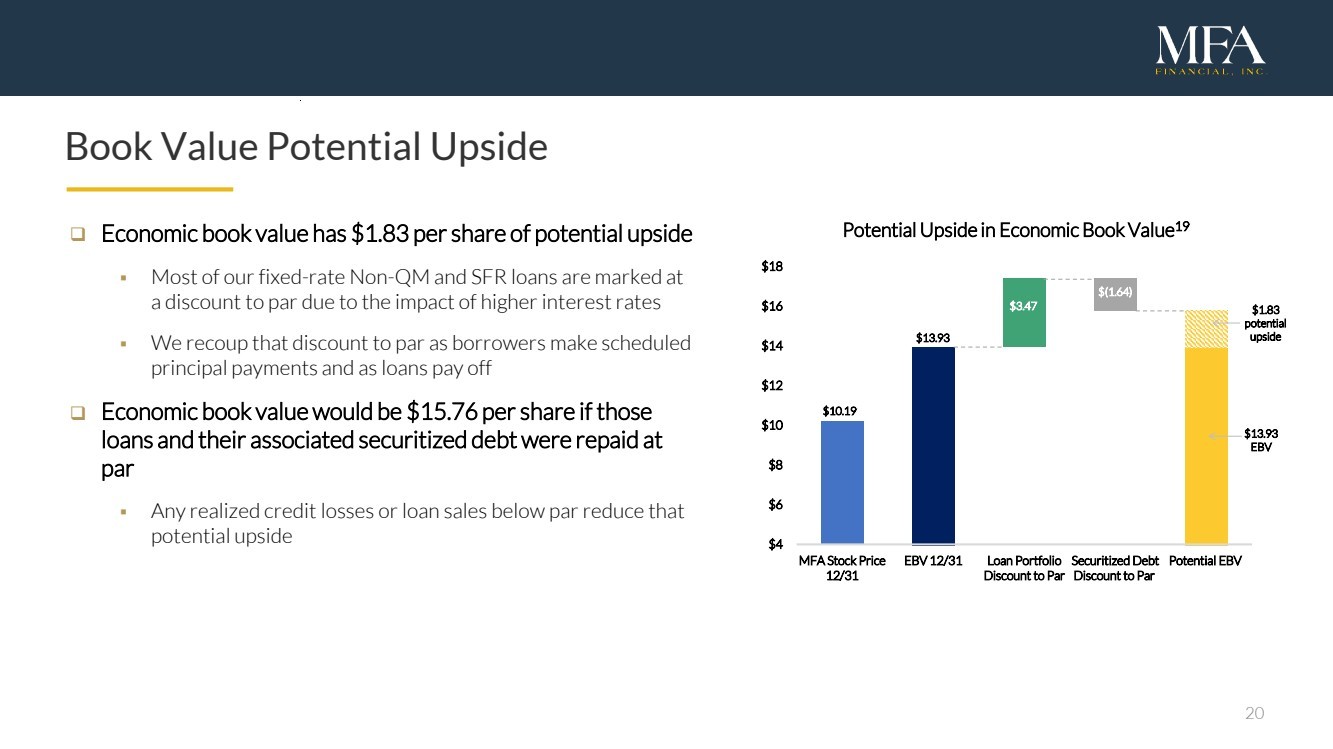
20 Book Value Potential Upside Economic book value has $1.83 per share of potential upside Most of our fixed-rate Non-QM and SFR loans are marked at a discount to par due to the impact of higher interest rates We recoup that discount to par as borrowers make scheduled principal payments and as loans pay off Economic book value would be $15.76 per share if those loans and their associated securitized debt were repaid at par Any realized credit losses or loan sales below par reduce that potential upside $4.84 $1.83 potential upside $13.93 EBV $4 $6 $8 $10 $12 $14 $16 $18 MFA Stock Price 12/31 EBV 12/31 Loan Portfolio Discount to Par Securitized Debt Discount to Par Potential EBV Potential Upside in Economic Book Value19 $13.93 $10.19 $3.47 $(1.64) |
|
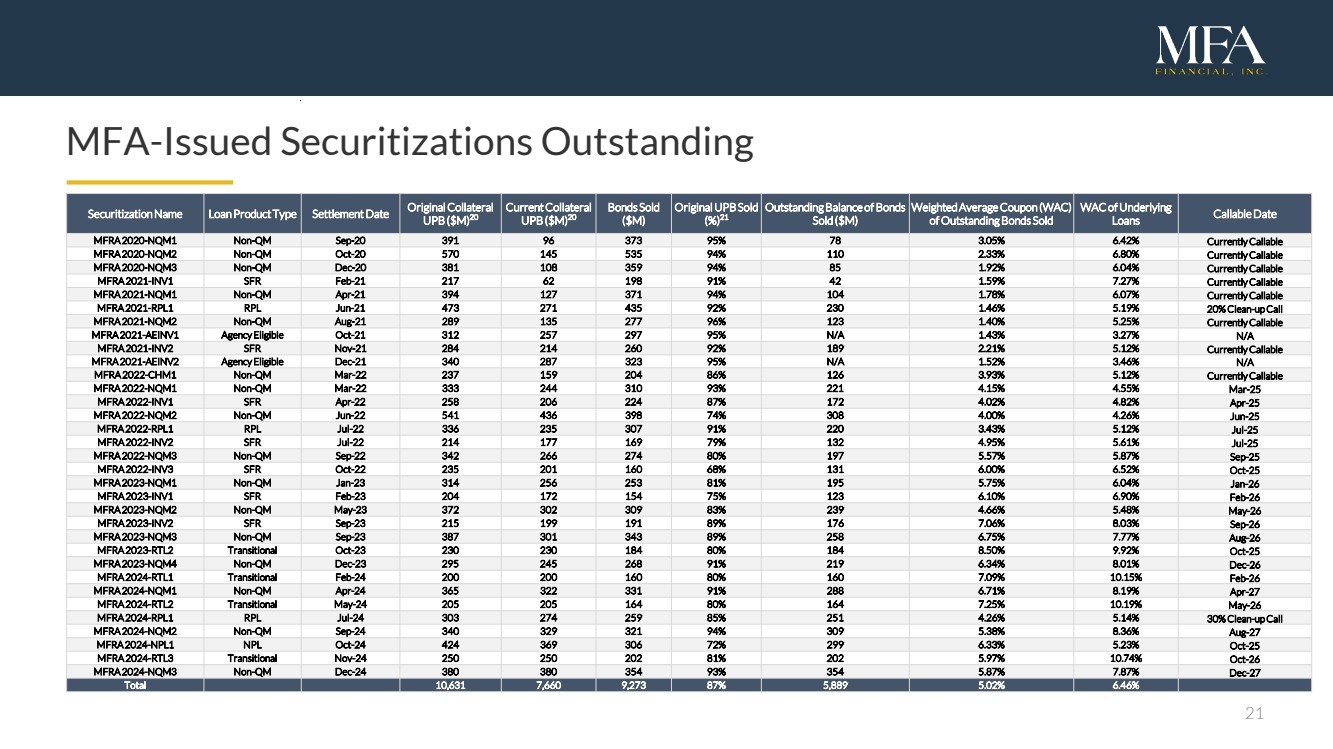
21 MFA-Issued Securitizations Outstanding Securitization Name Loan Product Type Settlement Date Original Collateral UPB ($M)20 Current Collateral UPB ($M)20 Bonds Sold ($M) Original UPB Sold (%)21 Outstanding Balance of Bonds Sold ($M) Weighted Average Coupon (WAC) of Outstanding Bonds Sold WAC of Underlying Loans Callable Date MFRA 2020-NQM1 Non-QM Sep-20 391 96 373 95% 78 3.05% 6.42% Currently Callable MFRA 2020-NQM2 Non-QM Oct-20 570 145 535 94% 110 2.33% 6.80% Currently Callable MFRA 2020-NQM3 Non-QM Dec-20 381 108 359 94% 85 1.92% 6.04% Currently Callable MFRA 2021-INV1 SFR Feb-21 217 62 198 91% 42 1.59% 7.27% Currently Callable MFRA 2021-NQM1 Non-QM Apr-21 394 127 371 94% 104 1.78% 6.07% Currently Callable MFRA 2021-RPL1 RPL Jun-21 473 271 435 92% 230 1.46% 5.19% 20% Clean-up Call MFRA 2021-NQM2 Non-QM Aug-21 289 135 277 96% 123 1.40% 5.25% Currently Callable MFRA 2021-AEINV1 Agency Eligible Oct-21 312 257 297 95% N/A 1.43% 3.27% N/A MFRA 2021-INV2 SFR Nov-21 284 214 260 92% 189 2.21% 5.12% Currently Callable MFRA 2021-AEINV2 Agency Eligible Dec-21 340 287 323 95% N/A 1.52% 3.46% N/A MFRA 2022-CHM1 Non-QM Mar-22 237 159 204 86% 126 3.93% 5.12% Currently Callable MFRA 2022-NQM1 Non-QM Mar-22 333 244 310 93% 221 4.15% 4.55% Mar-25 MFRA 2022-INV1 SFR Apr-22 258 206 224 87% 172 4.02% 4.82% Apr-25 MFRA 2022-NQM2 Non-QM Jun-22 541 436 398 74% 308 4.00% 4.26% Jun-25 MFRA 2022-RPL1 RPL Jul-22 336 235 307 91% 220 3.43% 5.12% Jul-25 MFRA 2022-INV2 SFR Jul-22 214 177 169 79% 132 4.95% 5.61% Jul-25 MFRA 2022-NQM3 Non-QM Sep-22 342 266 274 80% 197 5.57% 5.87% Sep-25 MFRA 2022-INV3 SFR Oct-22 235 201 160 68% 131 6.00% 6.52% Oct-25 MFRA 2023-NQM1 Non-QM Jan-23 314 256 253 81% 195 5.75% 6.04% Jan-26 MFRA 2023-INV1 SFR Feb-23 204 172 154 75% 123 6.10% 6.90% Feb-26 MFRA 2023-NQM2 Non-QM May-23 372 302 309 83% 239 4.66% 5.48% May-26 MFRA 2023-INV2 SFR Sep-23 215 199 191 89% 176 7.06% 8.03% Sep-26 MFRA 2023-NQM3 Non-QM Sep-23 387 301 343 89% 258 6.75% 7.77% Aug-26 MFRA 2023-RTL2 Transitional Oct-23 230 230 184 80% 184 8.50% 9.92% Oct-25 MFRA 2023-NQM4 Non-QM Dec-23 295 245 268 91% 219 6.34% 8.01% Dec-26 MFRA 2024-RTL1 Transitional Feb-24 200 200 160 80% 160 7.09% 10.15% Feb-26 MFRA 2024-NQM1 Non-QM Apr-24 365 322 331 91% 288 6.71% 8.19% Apr-27 MFRA 2024-RTL2 Transitional May-24 205 205 164 80% 164 7.25% 10.19% May-26 MFRA 2024-RPL1 RPL Jul-24 303 274 259 85% 251 4.26% 5.14% 30% Clean-up Call MFRA 2024-NQM2 Non-QM Sep-24 340 329 321 94% 309 5.38% 8.36% Aug-27 MFRA 2024-NPL1 NPL Oct-24 424 369 306 72% 299 6.33% 5.23% Oct-25 MFRA 2024-RTL3 Transitional Nov-24 250 250 202 81% 202 5.97% 10.74% Oct-26 MFRA 2024-NQM3 Non-QM Dec-24 380 380 354 93% 354 5.87% 7.87% Dec-27 Total 10,631 7,660 9,273 87% 5,889 5.02% 6.46% |
|
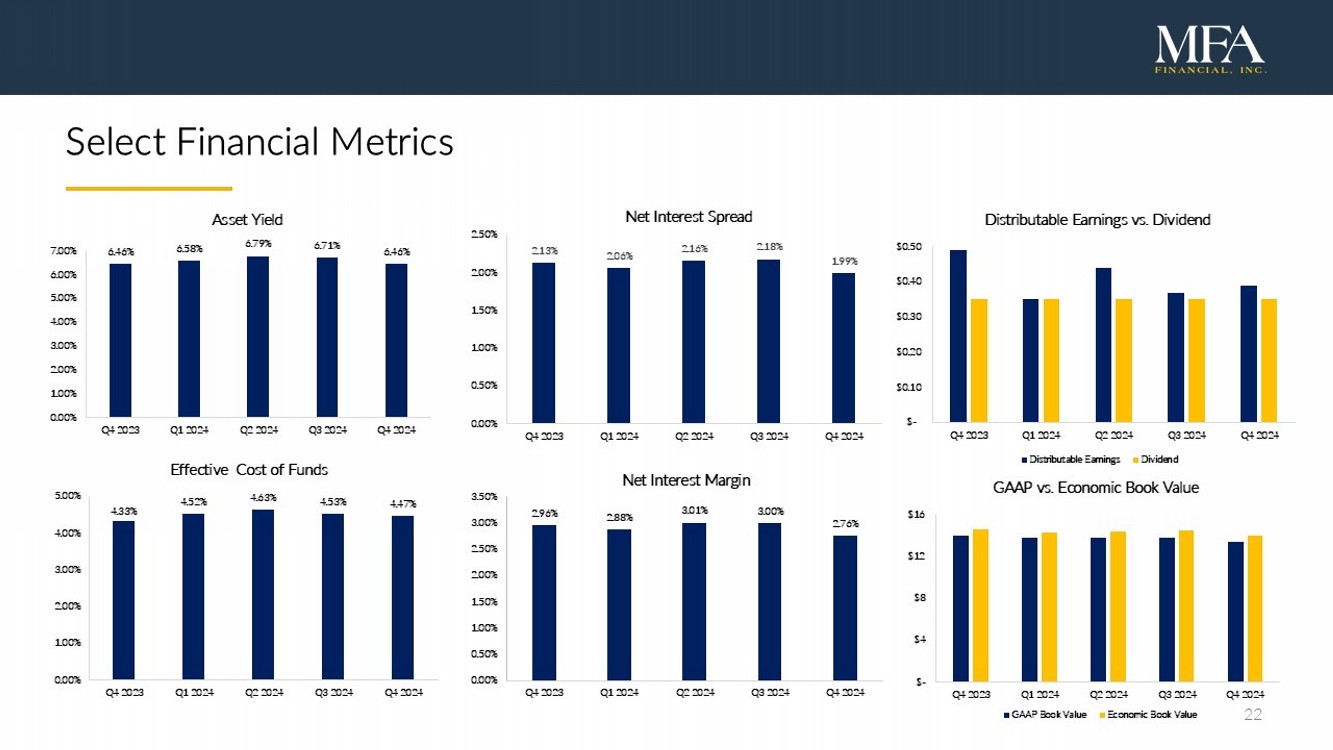
22 Select Financial Metrics 6.46% 6.58% 6.79% 6.71% 6.46% 0.00% 1.00% 2.00% 3.00% 4.00% 5.00% 6.00% 7.00% Q4 2023 Q1 2024 Q2 2024 Q3 2024 Q4 2024 Asset Yield 2.13% 2.06% 2.16% 2.18% 1.98% 0.00% 0.50% 1.00% 1.50% 2.00% 2.50% Q4 2023 Q1 2024 Q2 2024 Q3 2024 Q4 2024 Net Interest Spread 2.96% 2.88% 3.01% 3.00% 2.76% 0.00% 0.50% 1.00% 1.50% 2.00% 2.50% 3.00% 3.50% Q4 2023 Q1 2024 Q2 2024 Q3 2024 Q4 2024 Net Interest Margin 4.33% 4.52% 4.63% 4.53% 4.47% 0.00% 1.00% 2.00% 3.00% 4.00% 5.00% Q4 2023 Q1 2024 Q2 2024 Q3 2024 Q4 2024 Effective Cost of Funds $- $0.10 $0.20 $0.30 $0.40 $0.50 Q4 2023 Q1 2024 Q2 2024 Q3 2024 Q4 2024 Distributable Earnings vs. Dividend Distributable Earnings Dividend $- $4 $8 $12 $16 Q4 2023 Q1 2024 Q2 2024 Q3 2024 Q4 2024 GAAP vs. Economic Book Value GAAP Book Value Economic Book Value |
|
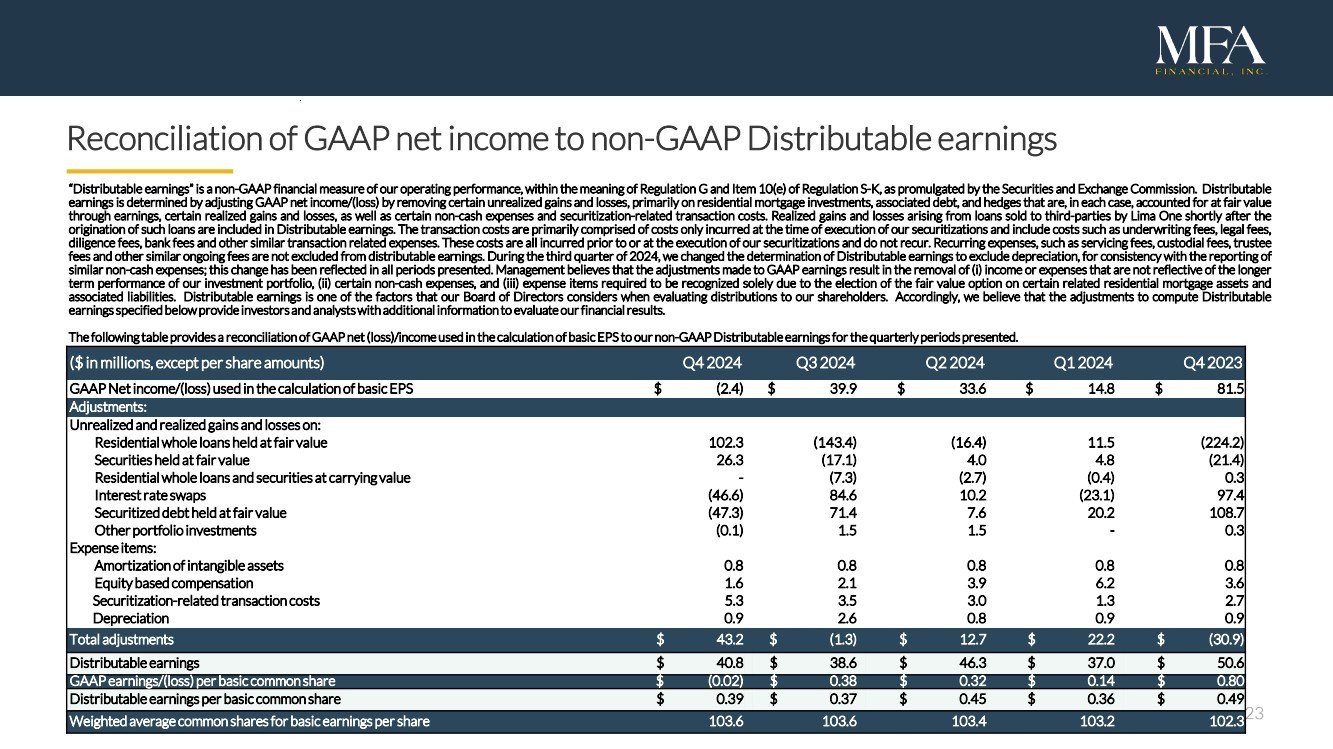
23 Reconciliation of GAAP net income to non-GAAP Distributable earnings “Distributable earnings” is a non-GAAP financial measure of our operating performance, within the meaning of Regulation G and Item 10(e) of Regulation S-K, as promulgated by the Securities and Exchange Commission. Distributable earnings is determined by adjusting GAAP net income/(loss) by removing certain unrealized gains and losses, primarily on residential mortgage investments, associated debt, and hedges that are, in each case, accounted for at fair value through earnings, certain realized gains and losses, as well as certain non-cash expenses and securitization-related transaction costs. Realized gains and losses arising from loans sold to third-parties by Lima One shortly after the origination of such loans are included in Distributable earnings. The transaction costs are primarily comprised of costs only incurred at the time of execution of our securitizations and include costs such as underwriting fees, legal fees, diligence fees, bank fees and other similar transaction related expenses. These costs are all incurred prior to or at the execution of our securitizations and do not recur. Recurring expenses, such as servicing fees, custodial fees, trustee fees and other similar ongoing fees are not excluded from distributable earnings. During the third quarter of 2024, we changed the determination of Distributable earnings to exclude depreciation, for consistency with the reporting of similar non-cash expenses; this change has been reflected in all periods presented. Management believes that the adjustments made to GAAP earnings result in the removal of (i) income or expenses that are not reflective of the longer term performance of our investment portfolio, (ii) certain non-cash expenses, and (iii) expense items required to be recognized solely due to the election of the fair value option on certain related residential mortgage assets and associated liabilities. Distributable earnings is one of the factors that our Board of Directors considers when evaluating distributions to our shareholders. Accordingly, we believe that the adjustments to compute Distributable earnings specified below provide investors and analysts with additional information to evaluate our financial results. The following table provides a reconciliation of GAAP net(loss)/income used in the calculation of basicEPS to our non-GAAP Distributable earnings forthe quarterly periodspresented. ($ in millions, except per share amounts) Q4 2024 Q3 2024 Q2 2024 Q1 2024 Q4 2023 GAAP Net income/(loss) used in the calculation of basic EPS $ (2.4) $ 39.9 $ 33.6 $ 14.8 $ 81.5 Adjustments: Unrealized and realized gains and losses on: Residential whole loans held at fair value 102.3 (143.4) (16.4) 11.5 (224.2) Securities held at fair value 26.3 (17.1) 4.0 4.8 (21.4) Residential whole loans and securities at carrying value - (7.3) (2.7) (0.4) 0.3 Interest rate swaps (46.6) 84.6 10.2 (23.1) 97.4 Securitized debt held at fair value (47.3) 71.4 7.6 20.2 108.7 Other portfolio investments (0.1) 1.5 1.5 - 0.3 Expense items: Amortization of intangible assets 0.8 0.8 0.8 0.8 0.8 Equity based compensation 1.6 2.1 3.9 6.2 3.6 Securitization-related transaction costs 5.3 3.5 3.0 1.3 2.7 Depreciation 0.9 2.6 0.8 0.9 0.9 Total adjustments $ 43.2 $ (1.3) $ 12.7 $ 22.2 $ (30.9) Distributable earnings $ 40.8 $ 38.6 $ 46.3 $ 37.0 $ 50.6 GAAP earnings/(loss) per basic common share $ (0.02) $ 0.38 $ 0.32 $ 0.14 $ 0.80 Distributable earnings per basic common share $ 0.39 $ 0.37 $ 0.45 $ 0.36 $ 0.49 Weighted average common shares for basic earnings per share 103.6 103.6 103.4 103.2 102.3 |
|
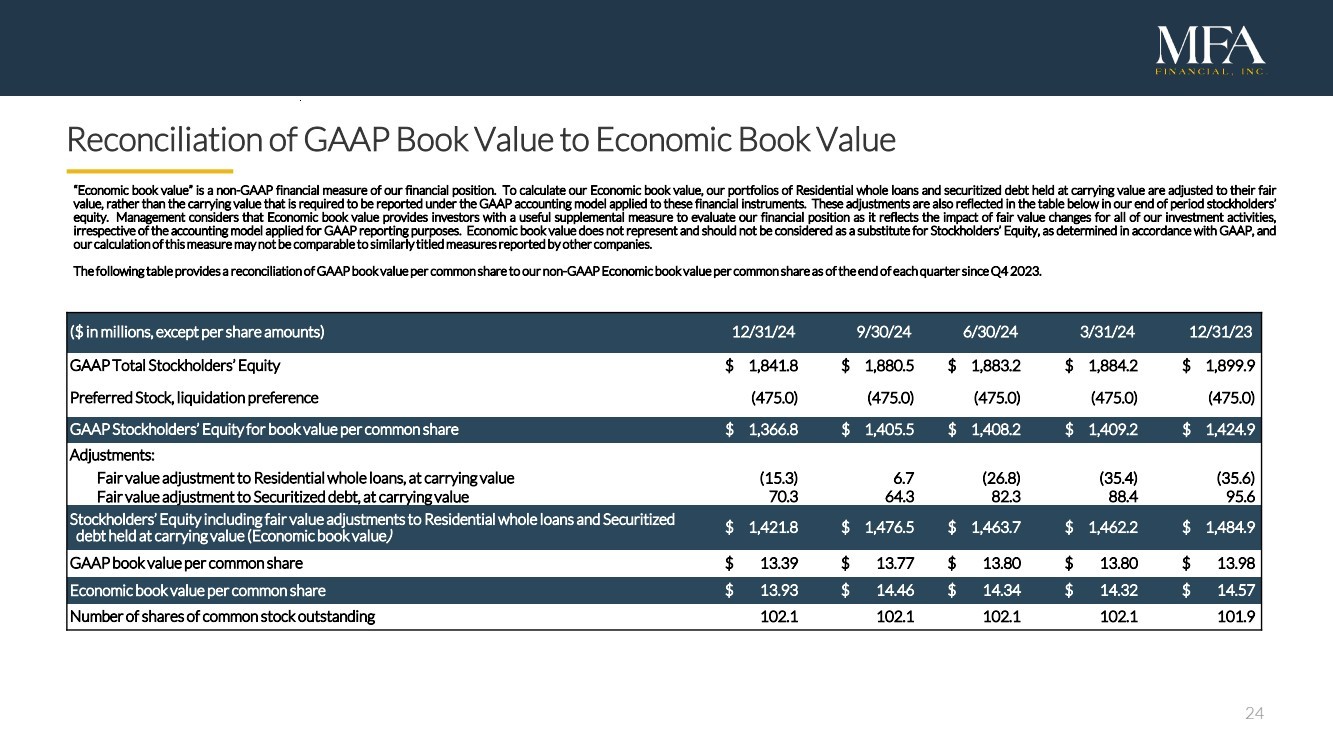
24 Reconciliation of GAAP Book Value to Economic Book Value “Economic book value” is a non-GAAP financial measure of our financial position. To calculate our Economic book value, our portfolios of Residential whole loans and securitized debt held at carrying value are adjusted to their fair value, rather than the carrying value that is required to be reported under the GAAP accounting model applied to these financial instruments. These adjustments are also reflected in the table below in our end of period stockholders’ equity. Management considers that Economic book value provides investors with a useful supplemental measure to evaluate our financial position as it reflects the impact of fair value changes for all of our investment activities, irrespective of the accounting model applied for GAAP reporting purposes. Economic book value does not represent and should not be considered as a substitute for Stockholders’ Equity, as determined in accordance with GAAP, and our calculation of this measure may not be comparable to similarly titled measures reported by other companies. The following table provides a reconciliation of GAAP book value per common share to our non-GAAP Economic book value per common share as of the end of each quarter since Q4 2023. ($ in millions, except per share amounts) 12/31/24 9/30/24 6/30/24 3/31/24 12/31/23 GAAP Total Stockholders’ Equity $ 1,841.8 $ 1,880.5 $ 1,883.2 $ 1,884.2 $ 1,899.9 Preferred Stock, liquidation preference (475.0) (475.0) (475.0) (475.0) (475.0) GAAP Stockholders’ Equity for book value per common share $ 1,366.8 $ 1,405.5 $ 1,408.2 $ 1,409.2 $ 1,424.9 Adjustments: Fair value adjustment to Residential whole loans, at carrying value (15.3) 6.7 (26.8) (35.4) (35.6) Fair value adjustment to Securitized debt, at carrying value 70.3 64.3 82.3 88.4 95.6 Stockholders’ Equity including fair value adjustments to Residential whole loans and Securitized debt held at carrying value (Economic book value) $ 1,421.8 $ 1,476.5 $ 1,463.7 $ 1,462.2 $ 1,484.9 GAAP book value per common share $ 13.39 $ 13.77 $ 13.80 $ 13.80 $ 13.98 Economic book value per common share $ 13.93 $ 14.46 $ 14.34 $ 14.32 $ 14.57 Number of shares of common stock outstanding 102.1 102.1 102.1 102.1 101.9 |
|
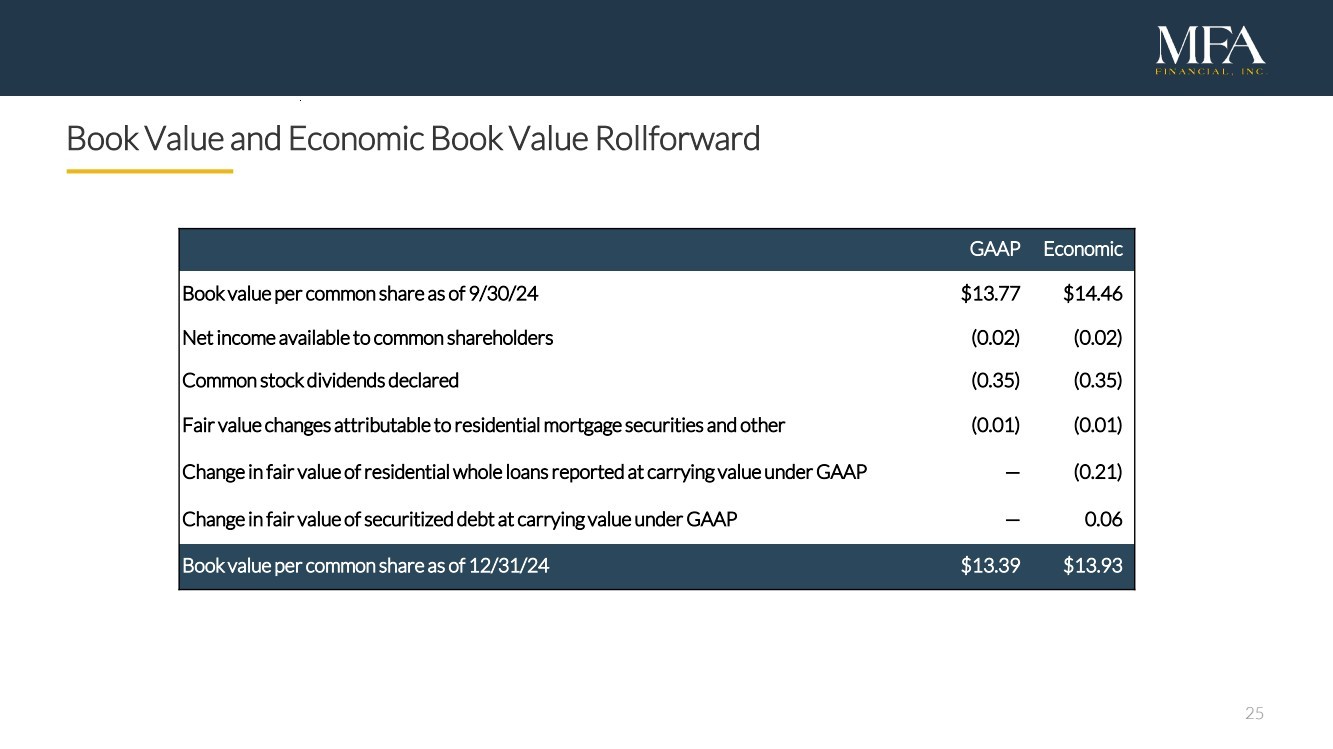
25 Book Value and Economic Book Value Rollforward GAAP Economic Book value per common share as of 9/30/24 $13.77 $14.46 Net income available to common shareholders (0.02) (0.02) Common stock dividends declared (0.35) (0.35) Fair value changes attributable to residential mortgage securities and other (0.01) (0.01) Change in fair value of residential whole loans reported at carrying value under GAAP — (0.21) Change in fair value of securitized debt at carrying value under GAAP — 0.06 Book value per common share as of 12/31/24 $13.39 $13.93 |
|
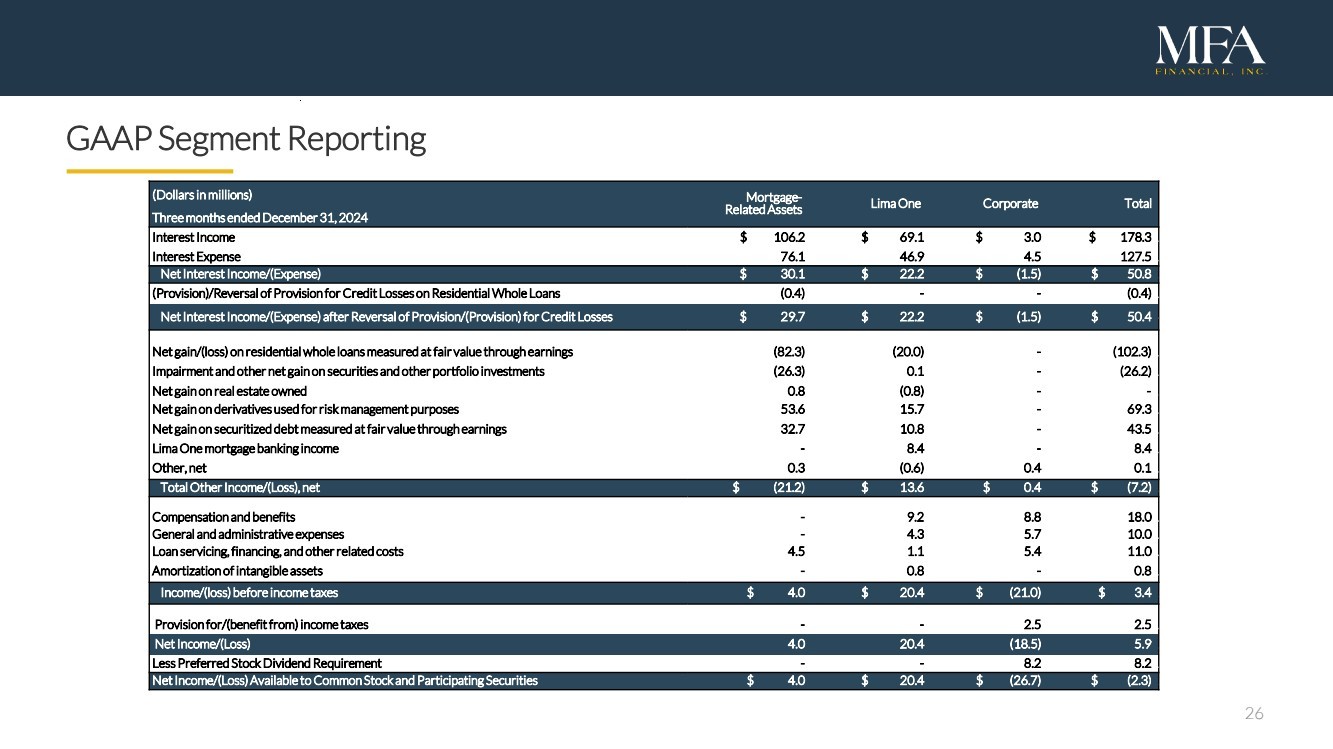
26 GAAP Segment Reporting (Dollars in millions) Mortgage- Related Assets Lima One Corporate Totald Three months ended December 31, 2024 Interest Income $ 106.2 $ 69.1 $ 3.0 $ 178.31 Interest Expense 76.1 46.9 4.5 127.51 Net Interest Income/(Expense) $ 30.1 $ 22.2 $ (1.5) $ 50.81 (Provision)/Reversal of Provision for Credit Losses on Residential Whole Loans (0.4) - - (0.4)1 Net Interest Income/(Expense) after Reversal of Provision/(Provision)for Credit Losses $ 29.7 $ 22.2 $ (1.5) $ 50.44 Net gain/(loss) on residential whole loans measured at fair value through earnings (82.3) (20.0) - (102.3)1 Impairment and other net gain on securities and other portfolio investments (26.3) 0.1 - (26.2)1 Net gain on real estate owned 0.8 (0.8) - -1 Net gain on derivatives used for risk management purposes 53.6 15.7 - 69.31 Net gain on securitized debt measured at fair value through earnings 32.7 10.8 - 43.51 Lima One mortgage banking income - 8.4 - 8.41 Other, net 0.3 (0.6) 0.4 0.11 Total Other Income/(Loss), net $ (21.2) $ 13.6 $ 0.4 $ (7.2)1 Compensation and benefits - 9.2 8.8 18.01 General and administrative expenses - 4.3 5.7 10.01 Loan servicing, financing, and other related costs 4.5 1.1 5.4 11.01 Amortization of intangible assets - 0.8 - 0.81 Income/(loss) before income taxes $ 4.0 $ 20.4 $ (21.0) $ 3.41 Provision for/(benefit from) income taxes - - 2.5 2.51 Net Income/(Loss) 4.0 20.4 (18.5) 5.91 Less Preferred Stock Dividend Requirement - - 8.2 8.21 Net Income/(Loss)Available to Common Stock and Participating Securities $ 4.0 $ 20.4 $ (26.7) $ (2.3)1 |
|
27 Endnotes 1) Purchased value of all residential whole loans acquired by MFA since 2014. 2) Economic book value is a non-GAAP financial measure. Refer to slide 24 for further information regarding the calculation of this measure and a reconciliation to GAAP book value. 3) GAAP net income presented per basic and diluted common share. 4) Distributable earnings is a non-GAAP financial measure. Refer to slide 23 for further information regarding the calculation of this measure and a reconciliation to GAAP net income. Distributable earnings presented per basic common share. 5) Recourse leverage is the ratio of MFA’s financing liabilities (excluding non-recourse debt) to net equity. Including Securitized Debt, MFA’s overall leverage ratio at December 31, 2024 was 5.0x. 6) Total economic return is calculated as the quarterly change in Economic Book Value (EBV) plus common dividends declared during the quarter divided by EBV at the start of the quarter. 7) Origination amount is based on the maximum loan amount, which includes amounts initially funded plus any committed but undrawn amounts. 8) Includes $151M of funded originations during Q4 plus $108M of draws funded during Q4 on previously originated Transitional loans. 9) Amounts presented reflect the aggregation of fair value and carrying value amounts as presented in MFA’s consolidated balance sheet at December 31, 2024. 10) Non-MTM refers to financing arrangements not subject to margin calls based on changes in the fair value of the financed residential whole loans. Such agreements may experience changes in advance rates or collateral eligibility as a result of factors such as changes in the delinquency status of the financed residential whole loans. 11) Swap variable receive rate is the Secured Overnight Financing Rate (SOFR). 12) LTV reflects principal amortization and estimated home price appreciation (or depreciation) since acquisition. Zillow Home Value Index (ZHVI) is utilized to estimate updated LTVs for Non-QM, SFR and Legacy RPL/NPL assets. For Transitional loans, LTV reflects either the current UPB divided by the most recent as-is property valuation available or the maximum UPB divided by the most recent after repaired value (ARV) available. 13) State concentration measured by loan balance. All states in “Other” category have concentrations below 5%. 14) CPR includes all principal repayments. 15) Balance sheet carrying value of REO properties at December 31, 2024. 16) Weighted average debt service coverage ratio (DSCR) at time of origination. 17) Percentage of loan portfolio extended beyond original maturity date as of December 31, 2024. 18) Represents status at December 31, 2024 of all Legacy RPL/NPL loans ever acquired. Non-performing status includes all active loans greater than 60 days delinquent. Liquidated/REO status includes both sold and active REO properties as well as short payoff liquidations and loans sold to third-parties. 19) Transitional loans are excluded from the calculation of potential upside in Economic book value. 20) Collateral UPB includes cash for Transitional loan securitizations. 21) Bonds sold relative to certificates issued. |